Native/Alaskan vs African In Labor Force | Age > 16
COMPARE
Native/Alaskan
African
In Labor Force | Age > 16
In Labor Force | Age > 16 Comparison
Natives/Alaskans
Africans
60.6%
IN LABOR FORCE | AGE > 16
0.0/ 100
METRIC RATING
335th/ 347
METRIC RANK
64.6%
IN LABOR FORCE | AGE > 16
5.8/ 100
METRIC RATING
232nd/ 347
METRIC RANK
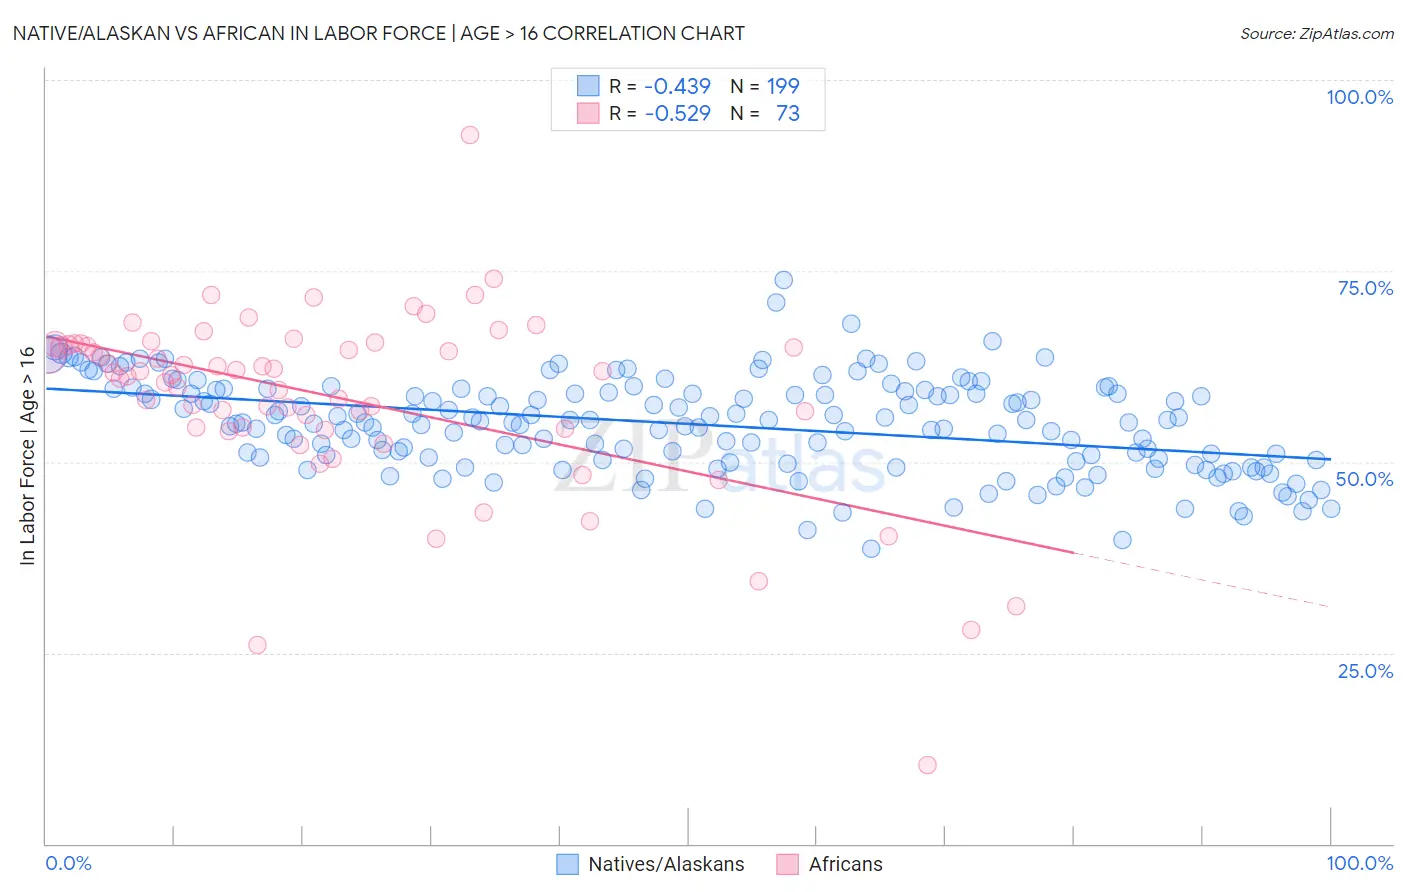
Native/Alaskan vs African In Labor Force | Age > 16 Correlation Chart
The statistical analysis conducted on geographies consisting of 513,032,279 people shows a moderate negative correlation between the proportion of Natives/Alaskans and labor force participation rate among population ages 16 and over in the United States with a correlation coefficient (R) of -0.439 and weighted average of 60.6%. Similarly, the statistical analysis conducted on geographies consisting of 470,091,127 people shows a substantial negative correlation between the proportion of Africans and labor force participation rate among population ages 16 and over in the United States with a correlation coefficient (R) of -0.529 and weighted average of 64.6%, a difference of 6.6%.
In Labor Force | Age > 16 Correlation Summary
| Measurement | Native/Alaskan | African |
| Minimum | 38.7% | 10.3% |
| Maximum | 73.8% | 92.8% |
| Range | 35.1% | 82.5% |
| Mean | 55.0% | 58.4% |
| Median | 55.3% | 61.6% |
| Interquartile 25% (IQ1) | 50.5% | 54.4% |
| Interquartile 75% (IQ3) | 59.3% | 65.3% |
| Interquartile Range (IQR) | 8.9% | 10.9% |
| Standard Deviation (Sample) | 6.1% | 12.3% |
| Standard Deviation (Population) | 6.1% | 12.2% |
Similar Demographics by In Labor Force | Age > 16
Demographics Similar to Natives/Alaskans by In Labor Force | Age > 16
In terms of in labor force | age > 16, the demographic groups most similar to Natives/Alaskans are Menominee (60.6%, a difference of 0.020%), Apache (60.7%, a difference of 0.19%), Paiute (60.7%, a difference of 0.23%), Crow (60.8%, a difference of 0.31%), and Ute (60.9%, a difference of 0.49%).
| Demographics | Rating | Rank | In Labor Force | Age > 16 |
| Dutch West Indians | 0.0 /100 | #328 | Tragic 61.7% |
| Choctaw | 0.0 /100 | #329 | Tragic 61.5% |
| Creek | 0.0 /100 | #330 | Tragic 61.3% |
| Ute | 0.0 /100 | #331 | Tragic 60.9% |
| Crow | 0.0 /100 | #332 | Tragic 60.8% |
| Paiute | 0.0 /100 | #333 | Tragic 60.7% |
| Apache | 0.0 /100 | #334 | Tragic 60.7% |
| Natives/Alaskans | 0.0 /100 | #335 | Tragic 60.6% |
| Menominee | 0.0 /100 | #336 | Tragic 60.6% |
| Colville | 0.0 /100 | #337 | Tragic 59.8% |
| Immigrants | Yemen | 0.0 /100 | #338 | Tragic 59.6% |
| Houma | 0.0 /100 | #339 | Tragic 59.5% |
| Pueblo | 0.0 /100 | #340 | Tragic 59.3% |
| Hopi | 0.0 /100 | #341 | Tragic 58.4% |
| Puerto Ricans | 0.0 /100 | #342 | Tragic 58.1% |
Demographics Similar to Africans by In Labor Force | Age > 16
In terms of in labor force | age > 16, the demographic groups most similar to Africans are Slavic (64.6%, a difference of 0.050%), Vietnamese (64.6%, a difference of 0.060%), Austrian (64.6%, a difference of 0.060%), British (64.7%, a difference of 0.070%), and Chinese (64.7%, a difference of 0.070%).
| Demographics | Rating | Rank | In Labor Force | Age > 16 |
| Croatians | 8.8 /100 | #225 | Tragic 64.7% |
| Europeans | 8.3 /100 | #226 | Tragic 64.7% |
| Poles | 8.3 /100 | #227 | Tragic 64.7% |
| Northern Europeans | 8.2 /100 | #228 | Tragic 64.7% |
| British | 7.3 /100 | #229 | Tragic 64.7% |
| Chinese | 7.3 /100 | #230 | Tragic 64.7% |
| Immigrants | Northern Europe | 7.2 /100 | #231 | Tragic 64.7% |
| Africans | 5.8 /100 | #232 | Tragic 64.6% |
| Slavs | 4.9 /100 | #233 | Tragic 64.6% |
| Vietnamese | 4.7 /100 | #234 | Tragic 64.6% |
| Austrians | 4.6 /100 | #235 | Tragic 64.6% |
| Immigrants | Norway | 4.6 /100 | #236 | Tragic 64.6% |
| Italians | 4.6 /100 | #237 | Tragic 64.6% |
| Lebanese | 3.9 /100 | #238 | Tragic 64.5% |
| Immigrants | Hungary | 3.8 /100 | #239 | Tragic 64.5% |