Kiowa vs African Disability Age Over 75
COMPARE
Kiowa
African
Disability Age Over 75
Disability Age Over 75 Comparison
Kiowa
Africans
54.2%
DISABILITY AGE OVER 75
0.0/ 100
METRIC RATING
335th/ 347
METRIC RANK
48.9%
DISABILITY AGE OVER 75
0.3/ 100
METRIC RATING
261st/ 347
METRIC RANK
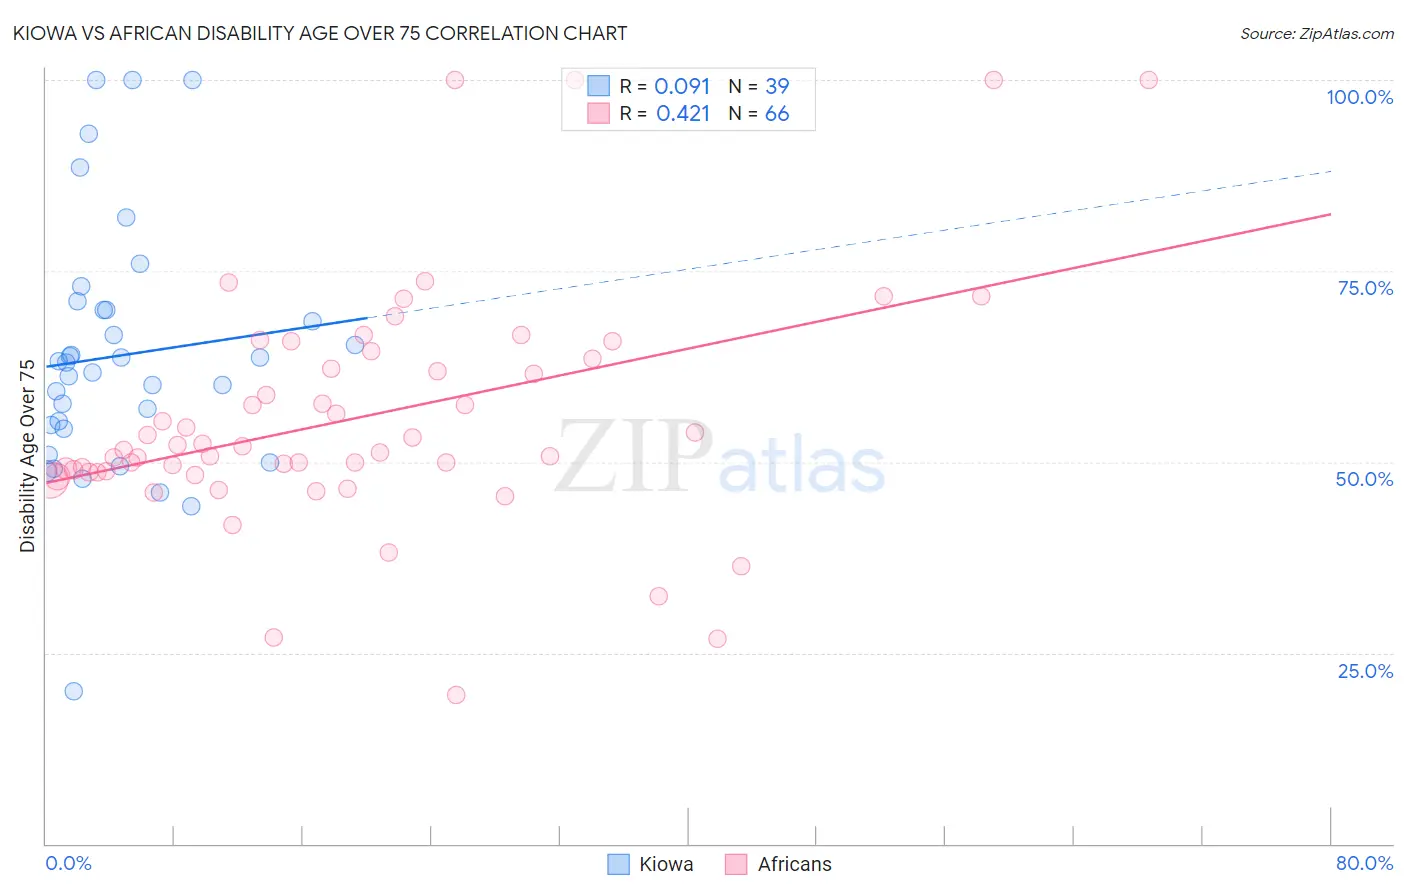
Kiowa vs African Disability Age Over 75 Correlation Chart
The statistical analysis conducted on geographies consisting of 56,070,567 people shows a slight positive correlation between the proportion of Kiowa and percentage of population with a disability over the age of 75 in the United States with a correlation coefficient (R) of 0.091 and weighted average of 54.2%. Similarly, the statistical analysis conducted on geographies consisting of 468,767,757 people shows a moderate positive correlation between the proportion of Africans and percentage of population with a disability over the age of 75 in the United States with a correlation coefficient (R) of 0.421 and weighted average of 48.9%, a difference of 11.0%.
Disability Age Over 75 Correlation Summary
| Measurement | Kiowa | African |
| Minimum | 20.0% | 19.4% |
| Maximum | 100.0% | 100.0% |
| Range | 80.0% | 80.6% |
| Mean | 63.9% | 55.8% |
| Median | 63.0% | 51.8% |
| Interquartile 25% (IQ1) | 54.3% | 48.7% |
| Interquartile 75% (IQ3) | 69.9% | 63.5% |
| Interquartile Range (IQR) | 15.6% | 14.9% |
| Standard Deviation (Sample) | 16.5% | 15.7% |
| Standard Deviation (Population) | 16.3% | 15.5% |
Similar Demographics by Disability Age Over 75
Demographics Similar to Kiowa by Disability Age Over 75
In terms of disability age over 75, the demographic groups most similar to Kiowa are Immigrants from Armenia (54.3%, a difference of 0.17%), Yuman (54.4%, a difference of 0.33%), Alaskan Athabascan (54.0%, a difference of 0.53%), Apache (53.6%, a difference of 1.2%), and Colville (55.4%, a difference of 2.1%).
| Demographics | Rating | Rank | Disability Age Over 75 |
| Choctaw | 0.0 /100 | #328 | Tragic 52.7% |
| Alaska Natives | 0.0 /100 | #329 | Tragic 52.8% |
| Puerto Ricans | 0.0 /100 | #330 | Tragic 52.9% |
| Hopi | 0.0 /100 | #331 | Tragic 52.9% |
| Natives/Alaskans | 0.0 /100 | #332 | Tragic 53.1% |
| Apache | 0.0 /100 | #333 | Tragic 53.6% |
| Alaskan Athabascans | 0.0 /100 | #334 | Tragic 54.0% |
| Kiowa | 0.0 /100 | #335 | Tragic 54.2% |
| Immigrants | Armenia | 0.0 /100 | #336 | Tragic 54.3% |
| Yuman | 0.0 /100 | #337 | Tragic 54.4% |
| Colville | 0.0 /100 | #338 | Tragic 55.4% |
| Pima | 0.0 /100 | #339 | Tragic 55.8% |
| Pueblo | 0.0 /100 | #340 | Tragic 55.9% |
| Houma | 0.0 /100 | #341 | Tragic 56.2% |
| Lumbee | 0.0 /100 | #342 | Tragic 56.2% |
Demographics Similar to Africans by Disability Age Over 75
In terms of disability age over 75, the demographic groups most similar to Africans are Immigrants from Afghanistan (48.8%, a difference of 0.060%), Immigrants from West Indies (48.9%, a difference of 0.060%), Salvadoran (48.9%, a difference of 0.080%), Central American (48.8%, a difference of 0.10%), and Immigrants from Honduras (48.9%, a difference of 0.13%).
| Demographics | Rating | Rank | Disability Age Over 75 |
| Immigrants | Vietnam | 0.6 /100 | #254 | Tragic 48.7% |
| Chinese | 0.5 /100 | #255 | Tragic 48.7% |
| Immigrants | Congo | 0.5 /100 | #256 | Tragic 48.7% |
| Blackfeet | 0.5 /100 | #257 | Tragic 48.8% |
| Immigrants | Philippines | 0.4 /100 | #258 | Tragic 48.8% |
| Central Americans | 0.4 /100 | #259 | Tragic 48.8% |
| Immigrants | Afghanistan | 0.4 /100 | #260 | Tragic 48.8% |
| Africans | 0.3 /100 | #261 | Tragic 48.9% |
| Immigrants | West Indies | 0.3 /100 | #262 | Tragic 48.9% |
| Salvadorans | 0.3 /100 | #263 | Tragic 48.9% |
| Immigrants | Honduras | 0.3 /100 | #264 | Tragic 48.9% |
| Hondurans | 0.3 /100 | #265 | Tragic 48.9% |
| U.S. Virgin Islanders | 0.2 /100 | #266 | Tragic 48.9% |
| Malaysians | 0.2 /100 | #267 | Tragic 49.0% |
| Guatemalans | 0.2 /100 | #268 | Tragic 49.0% |