Native/Alaskan vs African 12th Grade, No Diploma
COMPARE
Native/Alaskan
African
12th Grade, No Diploma
12th Grade, No Diploma Comparison
Natives/Alaskans
Africans
87.7%
12TH GRADE, NO DIPLOMA
0.0/ 100
METRIC RATING
306th/ 347
METRIC RANK
89.6%
12TH GRADE, NO DIPLOMA
0.4/ 100
METRIC RATING
258th/ 347
METRIC RANK
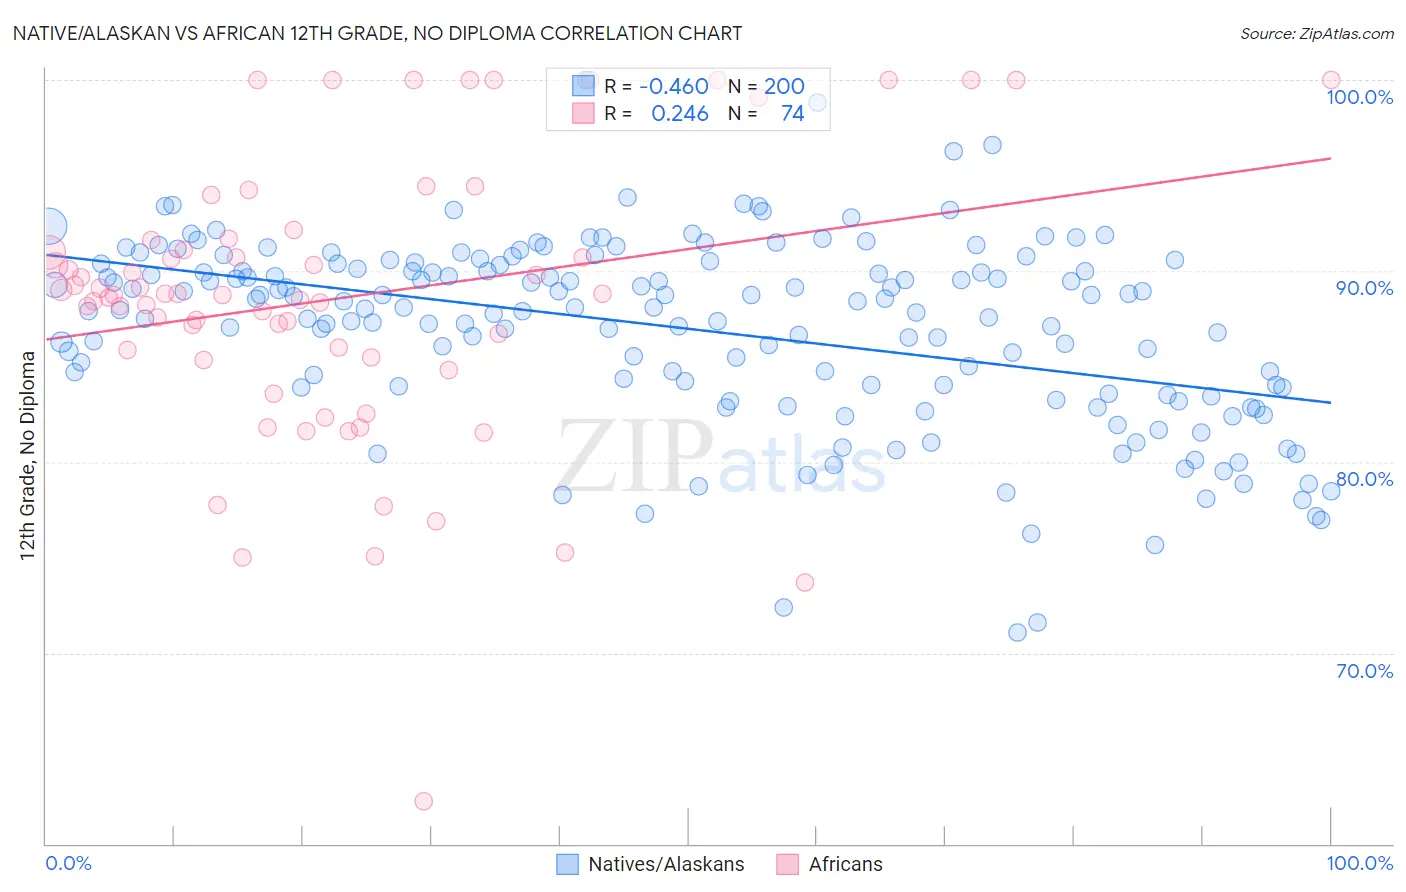
Native/Alaskan vs African 12th Grade, No Diploma Correlation Chart
The statistical analysis conducted on geographies consisting of 513,075,812 people shows a moderate negative correlation between the proportion of Natives/Alaskans and percentage of population with at least 12th grade (no diploma) education in the United States with a correlation coefficient (R) of -0.460 and weighted average of 87.7%. Similarly, the statistical analysis conducted on geographies consisting of 470,094,658 people shows a weak positive correlation between the proportion of Africans and percentage of population with at least 12th grade (no diploma) education in the United States with a correlation coefficient (R) of 0.246 and weighted average of 89.6%, a difference of 2.2%.
12th Grade, No Diploma Correlation Summary
| Measurement | Native/Alaskan | African |
| Minimum | 71.1% | 62.2% |
| Maximum | 100.0% | 100.0% |
| Range | 28.9% | 37.8% |
| Mean | 87.0% | 88.6% |
| Median | 88.1% | 88.8% |
| Interquartile 25% (IQ1) | 83.9% | 85.4% |
| Interquartile 75% (IQ3) | 90.3% | 91.6% |
| Interquartile Range (IQR) | 6.4% | 6.2% |
| Standard Deviation (Sample) | 4.9% | 7.4% |
| Standard Deviation (Population) | 4.9% | 7.3% |
Similar Demographics by 12th Grade, No Diploma
Demographics Similar to Natives/Alaskans by 12th Grade, No Diploma
In terms of 12th grade, no diploma, the demographic groups most similar to Natives/Alaskans are Immigrants from Portugal (87.6%, a difference of 0.040%), Immigrants from Dominica (87.7%, a difference of 0.070%), Yup'ik (87.6%, a difference of 0.080%), Immigrants from Armenia (87.6%, a difference of 0.11%), and Immigrants from Cuba (87.5%, a difference of 0.16%).
| Demographics | Rating | Rank | 12th Grade, No Diploma |
| Nepalese | 0.0 /100 | #299 | Tragic 88.1% |
| Immigrants | Guyana | 0.0 /100 | #300 | Tragic 88.1% |
| Immigrants | Cambodia | 0.0 /100 | #301 | Tragic 88.1% |
| Ecuadorians | 0.0 /100 | #302 | Tragic 88.0% |
| Immigrants | Bangladesh | 0.0 /100 | #303 | Tragic 88.0% |
| Vietnamese | 0.0 /100 | #304 | Tragic 87.9% |
| Immigrants | Dominica | 0.0 /100 | #305 | Tragic 87.7% |
| Natives/Alaskans | 0.0 /100 | #306 | Tragic 87.7% |
| Immigrants | Portugal | 0.0 /100 | #307 | Tragic 87.6% |
| Yup'ik | 0.0 /100 | #308 | Tragic 87.6% |
| Immigrants | Armenia | 0.0 /100 | #309 | Tragic 87.6% |
| Immigrants | Cuba | 0.0 /100 | #310 | Tragic 87.5% |
| Yaqui | 0.0 /100 | #311 | Tragic 87.5% |
| Immigrants | Ecuador | 0.0 /100 | #312 | Tragic 87.5% |
| Immigrants | Caribbean | 0.0 /100 | #313 | Tragic 87.4% |
Demographics Similar to Africans by 12th Grade, No Diploma
In terms of 12th grade, no diploma, the demographic groups most similar to Africans are Immigrants from Western Africa (89.6%, a difference of 0.020%), Immigrants from South Eastern Asia (89.6%, a difference of 0.040%), Cheyenne (89.6%, a difference of 0.040%), Sioux (89.6%, a difference of 0.040%), and Immigrants from Ghana (89.7%, a difference of 0.050%).
| Demographics | Rating | Rank | 12th Grade, No Diploma |
| Spanish Americans | 0.9 /100 | #251 | Tragic 89.9% |
| Bahamians | 0.9 /100 | #252 | Tragic 89.9% |
| Choctaw | 0.7 /100 | #253 | Tragic 89.8% |
| Immigrants | Peru | 0.5 /100 | #254 | Tragic 89.7% |
| Immigrants | Senegal | 0.5 /100 | #255 | Tragic 89.7% |
| Immigrants | Ghana | 0.5 /100 | #256 | Tragic 89.7% |
| Jamaicans | 0.5 /100 | #257 | Tragic 89.7% |
| Africans | 0.4 /100 | #258 | Tragic 89.6% |
| Immigrants | Western Africa | 0.4 /100 | #259 | Tragic 89.6% |
| Immigrants | South Eastern Asia | 0.4 /100 | #260 | Tragic 89.6% |
| Cheyenne | 0.4 /100 | #261 | Tragic 89.6% |
| Sioux | 0.4 /100 | #262 | Tragic 89.6% |
| Immigrants | Jamaica | 0.2 /100 | #263 | Tragic 89.5% |
| Sri Lankans | 0.2 /100 | #264 | Tragic 89.4% |
| Trinidadians and Tobagonians | 0.2 /100 | #265 | Tragic 89.4% |