Native/Alaskan vs African Unemployment Among Women with Children Under 18 years
COMPARE
Native/Alaskan
African
Unemployment Among Women with Children Under 18 years
Unemployment Among Women with Children Under 18 years Comparison
Natives/Alaskans
Africans
7.2%
UNEMPLOYMENT AMONG WOMEN WITH CHILDREN UNDER 18 YEARS
0.0/ 100
METRIC RATING
328th/ 347
METRIC RANK
6.5%
UNEMPLOYMENT AMONG WOMEN WITH CHILDREN UNDER 18 YEARS
0.0/ 100
METRIC RATING
308th/ 347
METRIC RANK
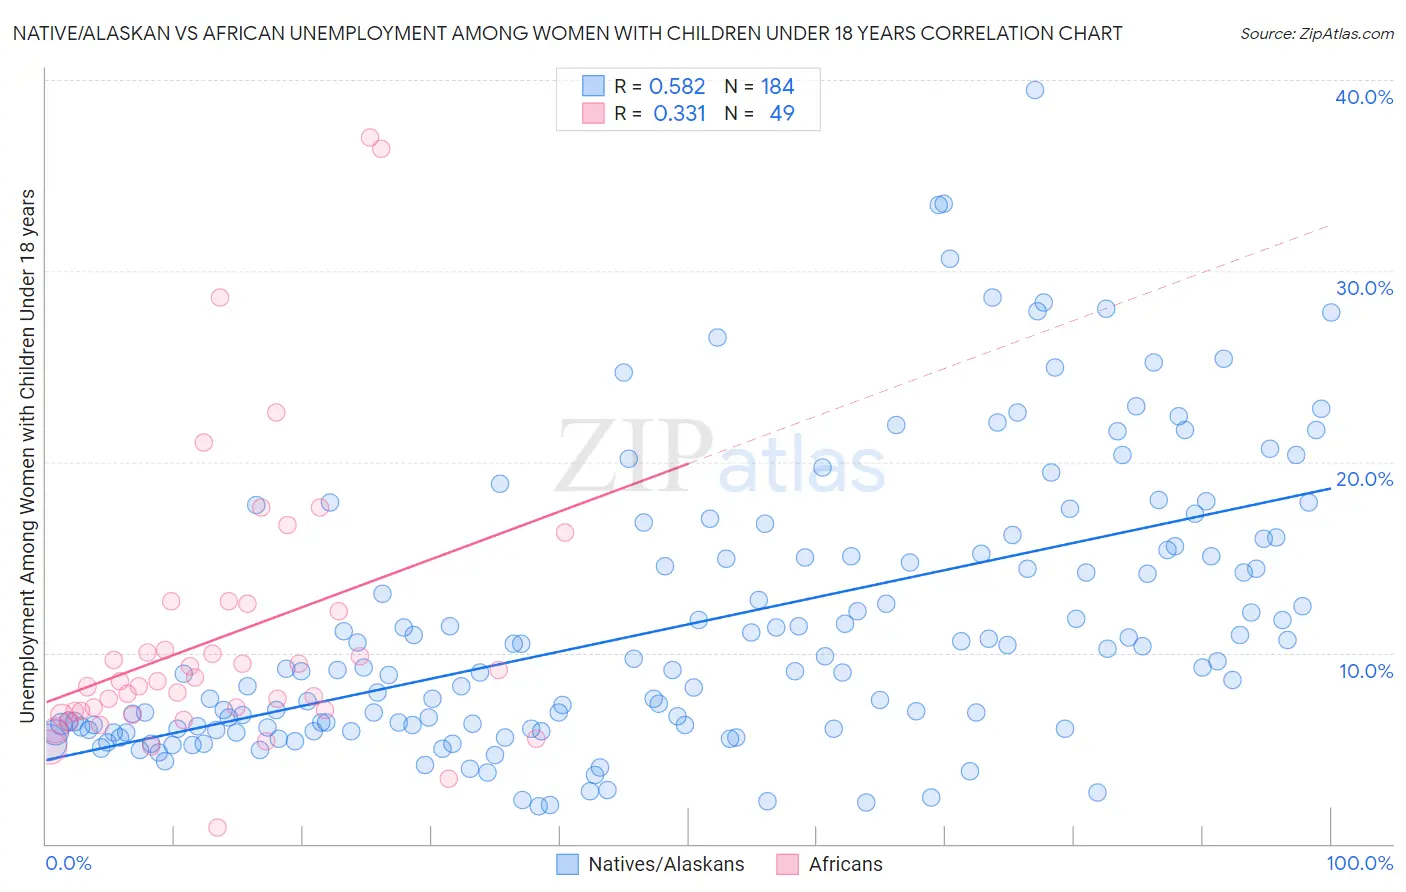
Native/Alaskan vs African Unemployment Among Women with Children Under 18 years Correlation Chart
The statistical analysis conducted on geographies consisting of 478,925,590 people shows a substantial positive correlation between the proportion of Natives/Alaskans and unemployment rate among women with children under the age of 18 in the United States with a correlation coefficient (R) of 0.582 and weighted average of 7.2%. Similarly, the statistical analysis conducted on geographies consisting of 448,423,586 people shows a mild positive correlation between the proportion of Africans and unemployment rate among women with children under the age of 18 in the United States with a correlation coefficient (R) of 0.331 and weighted average of 6.5%, a difference of 10.9%.
Unemployment Among Women with Children Under 18 years Correlation Summary
| Measurement | Native/Alaskan | African |
| Minimum | 1.9% | 0.83% |
| Maximum | 39.5% | 37.0% |
| Range | 37.5% | 36.2% |
| Mean | 11.4% | 10.8% |
| Median | 9.1% | 8.5% |
| Interquartile 25% (IQ1) | 6.0% | 6.8% |
| Interquartile 75% (IQ3) | 15.1% | 12.4% |
| Interquartile Range (IQR) | 9.1% | 5.6% |
| Standard Deviation (Sample) | 7.3% | 7.4% |
| Standard Deviation (Population) | 7.3% | 7.3% |
Demographics Similar to Natives/Alaskans and Africans by Unemployment Among Women with Children Under 18 years
In terms of unemployment among women with children under 18 years, the demographic groups most similar to Natives/Alaskans are Lumbee (7.1%, a difference of 2.4%), Chippewa (7.0%, a difference of 3.2%), Immigrants from Dominica (7.0%, a difference of 4.0%), Paiute (6.9%, a difference of 5.2%), and Pueblo (6.8%, a difference of 6.2%). Similarly, the demographic groups most similar to Africans are Ecuadorian (6.5%, a difference of 0.090%), Guyanese (6.6%, a difference of 0.33%), Yaqui (6.6%, a difference of 0.63%), Immigrants from Mexico (6.6%, a difference of 0.72%), and Hispanic or Latino (6.6%, a difference of 1.0%).
| Demographics | Rating | Rank | Unemployment Among Women with Children Under 18 years |
| Africans | 0.0 /100 | #308 | Tragic 6.5% |
| Ecuadorians | 0.0 /100 | #309 | Tragic 6.5% |
| Guyanese | 0.0 /100 | #310 | Tragic 6.6% |
| Yaqui | 0.0 /100 | #311 | Tragic 6.6% |
| Immigrants | Mexico | 0.0 /100 | #312 | Tragic 6.6% |
| Hispanics or Latinos | 0.0 /100 | #313 | Tragic 6.6% |
| British West Indians | 0.0 /100 | #314 | Tragic 6.6% |
| Immigrants | West Indies | 0.0 /100 | #315 | Tragic 6.6% |
| Immigrants | Ecuador | 0.0 /100 | #316 | Tragic 6.6% |
| Shoshone | 0.0 /100 | #317 | Tragic 6.6% |
| Alaska Natives | 0.0 /100 | #318 | Tragic 6.7% |
| Central American Indians | 0.0 /100 | #319 | Tragic 6.7% |
| Immigrants | Belize | 0.0 /100 | #320 | Tragic 6.7% |
| U.S. Virgin Islanders | 0.0 /100 | #321 | Tragic 6.7% |
| Houma | 0.0 /100 | #322 | Tragic 6.8% |
| Pueblo | 0.0 /100 | #323 | Tragic 6.8% |
| Paiute | 0.0 /100 | #324 | Tragic 6.9% |
| Immigrants | Dominica | 0.0 /100 | #325 | Tragic 7.0% |
| Chippewa | 0.0 /100 | #326 | Tragic 7.0% |
| Lumbee | 0.0 /100 | #327 | Tragic 7.1% |
| Natives/Alaskans | 0.0 /100 | #328 | Tragic 7.2% |