Immigrants from Middle Africa vs African Disability Age Over 75
COMPARE
Immigrants from Middle Africa
African
Disability Age Over 75
Disability Age Over 75 Comparison
Immigrants from Middle Africa
Africans
47.1%
DISABILITY AGE OVER 75
68.3/ 100
METRIC RATING
160th/ 347
METRIC RANK
48.9%
DISABILITY AGE OVER 75
0.3/ 100
METRIC RATING
261st/ 347
METRIC RANK
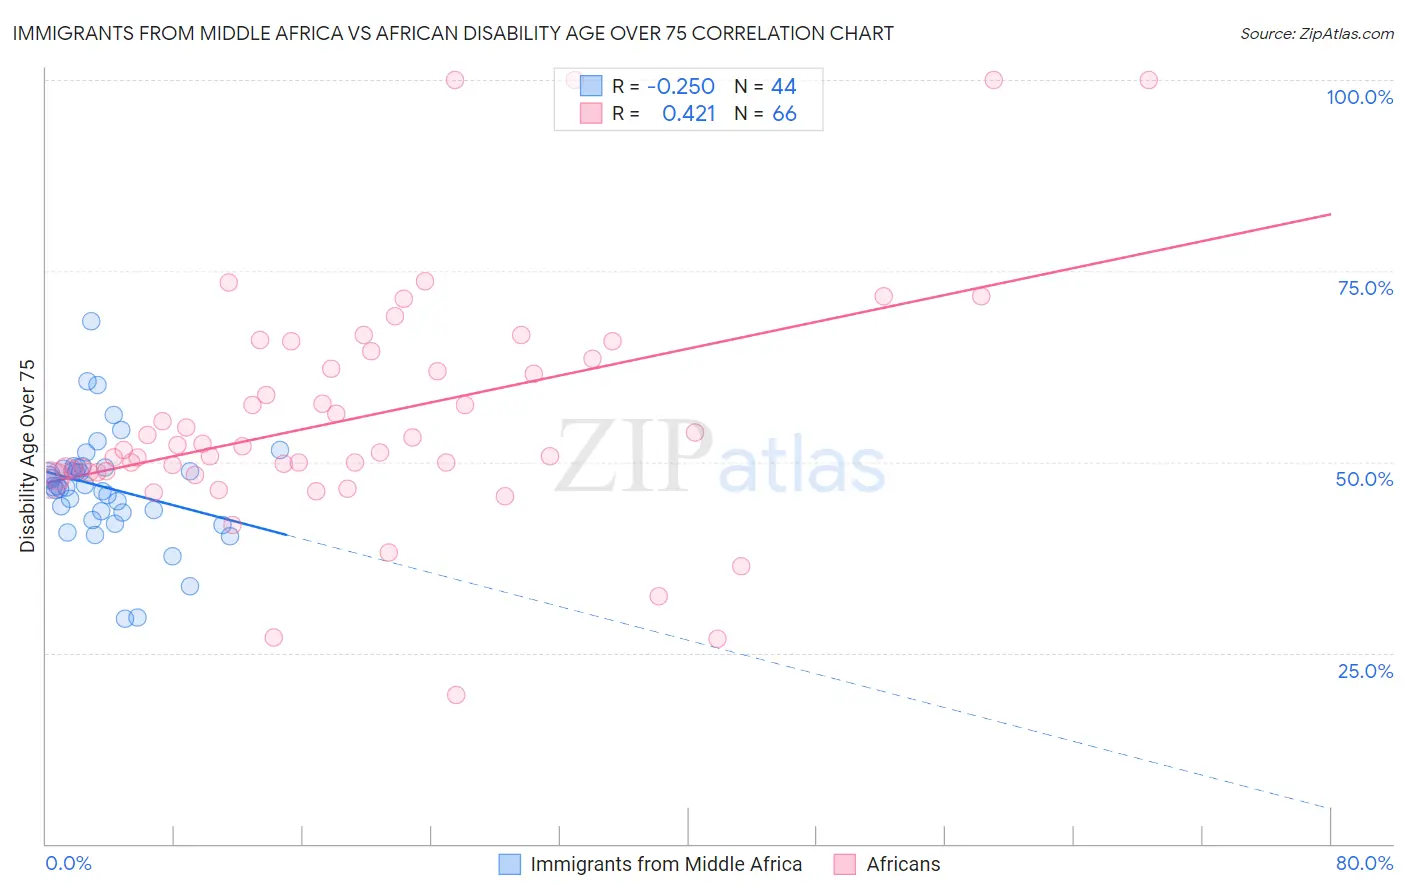
Immigrants from Middle Africa vs African Disability Age Over 75 Correlation Chart
The statistical analysis conducted on geographies consisting of 202,484,916 people shows a weak negative correlation between the proportion of Immigrants from Middle Africa and percentage of population with a disability over the age of 75 in the United States with a correlation coefficient (R) of -0.250 and weighted average of 47.1%. Similarly, the statistical analysis conducted on geographies consisting of 468,767,757 people shows a moderate positive correlation between the proportion of Africans and percentage of population with a disability over the age of 75 in the United States with a correlation coefficient (R) of 0.421 and weighted average of 48.9%, a difference of 3.6%.
Disability Age Over 75 Correlation Summary
| Measurement | Immigrants from Middle Africa | African |
| Minimum | 29.5% | 19.4% |
| Maximum | 68.4% | 100.0% |
| Range | 38.9% | 80.6% |
| Mean | 46.7% | 55.8% |
| Median | 46.8% | 51.8% |
| Interquartile 25% (IQ1) | 43.4% | 48.7% |
| Interquartile 75% (IQ3) | 49.3% | 63.5% |
| Interquartile Range (IQR) | 5.9% | 14.9% |
| Standard Deviation (Sample) | 7.1% | 15.7% |
| Standard Deviation (Population) | 7.1% | 15.5% |
Similar Demographics by Disability Age Over 75
Demographics Similar to Immigrants from Middle Africa by Disability Age Over 75
In terms of disability age over 75, the demographic groups most similar to Immigrants from Middle Africa are South American Indian (47.1%, a difference of 0.010%), Pennsylvania German (47.2%, a difference of 0.060%), Immigrants from Eastern Africa (47.2%, a difference of 0.070%), Immigrants from Morocco (47.1%, a difference of 0.080%), and French (47.2%, a difference of 0.090%).
| Demographics | Rating | Rank | Disability Age Over 75 |
| Immigrants | Zaire | 74.8 /100 | #153 | Good 47.1% |
| Immigrants | Belarus | 74.8 /100 | #154 | Good 47.1% |
| Immigrants | Iran | 74.7 /100 | #155 | Good 47.1% |
| Arabs | 73.3 /100 | #156 | Good 47.1% |
| Bhutanese | 72.6 /100 | #157 | Good 47.1% |
| Immigrants | Guyana | 71.9 /100 | #158 | Good 47.1% |
| Immigrants | Morocco | 71.4 /100 | #159 | Good 47.1% |
| Immigrants | Middle Africa | 68.3 /100 | #160 | Good 47.1% |
| South American Indians | 68.1 /100 | #161 | Good 47.1% |
| Pennsylvania Germans | 66.0 /100 | #162 | Good 47.2% |
| Immigrants | Eastern Africa | 65.5 /100 | #163 | Good 47.2% |
| French | 64.6 /100 | #164 | Good 47.2% |
| Immigrants | Zimbabwe | 64.4 /100 | #165 | Good 47.2% |
| Immigrants | Sierra Leone | 64.4 /100 | #166 | Good 47.2% |
| Moroccans | 62.9 /100 | #167 | Good 47.2% |
Demographics Similar to Africans by Disability Age Over 75
In terms of disability age over 75, the demographic groups most similar to Africans are Immigrants from Afghanistan (48.8%, a difference of 0.060%), Immigrants from West Indies (48.9%, a difference of 0.060%), Salvadoran (48.9%, a difference of 0.080%), Central American (48.8%, a difference of 0.10%), and Immigrants from Honduras (48.9%, a difference of 0.13%).
| Demographics | Rating | Rank | Disability Age Over 75 |
| Immigrants | Vietnam | 0.6 /100 | #254 | Tragic 48.7% |
| Chinese | 0.5 /100 | #255 | Tragic 48.7% |
| Immigrants | Congo | 0.5 /100 | #256 | Tragic 48.7% |
| Blackfeet | 0.5 /100 | #257 | Tragic 48.8% |
| Immigrants | Philippines | 0.4 /100 | #258 | Tragic 48.8% |
| Central Americans | 0.4 /100 | #259 | Tragic 48.8% |
| Immigrants | Afghanistan | 0.4 /100 | #260 | Tragic 48.8% |
| Africans | 0.3 /100 | #261 | Tragic 48.9% |
| Immigrants | West Indies | 0.3 /100 | #262 | Tragic 48.9% |
| Salvadorans | 0.3 /100 | #263 | Tragic 48.9% |
| Immigrants | Honduras | 0.3 /100 | #264 | Tragic 48.9% |
| Hondurans | 0.3 /100 | #265 | Tragic 48.9% |
| U.S. Virgin Islanders | 0.2 /100 | #266 | Tragic 48.9% |
| Malaysians | 0.2 /100 | #267 | Tragic 49.0% |
| Guatemalans | 0.2 /100 | #268 | Tragic 49.0% |