Macedonian vs White/Caucasian No Schooling Completed
COMPARE
Macedonian
White/Caucasian
No Schooling Completed
No Schooling Completed Comparison
Macedonians
Whites/Caucasians
1.7%
NO SCHOOLING COMPLETED
99.3/ 100
METRIC RATING
79th/ 347
METRIC RANK
1.6%
NO SCHOOLING COMPLETED
99.9/ 100
METRIC RATING
49th/ 347
METRIC RANK
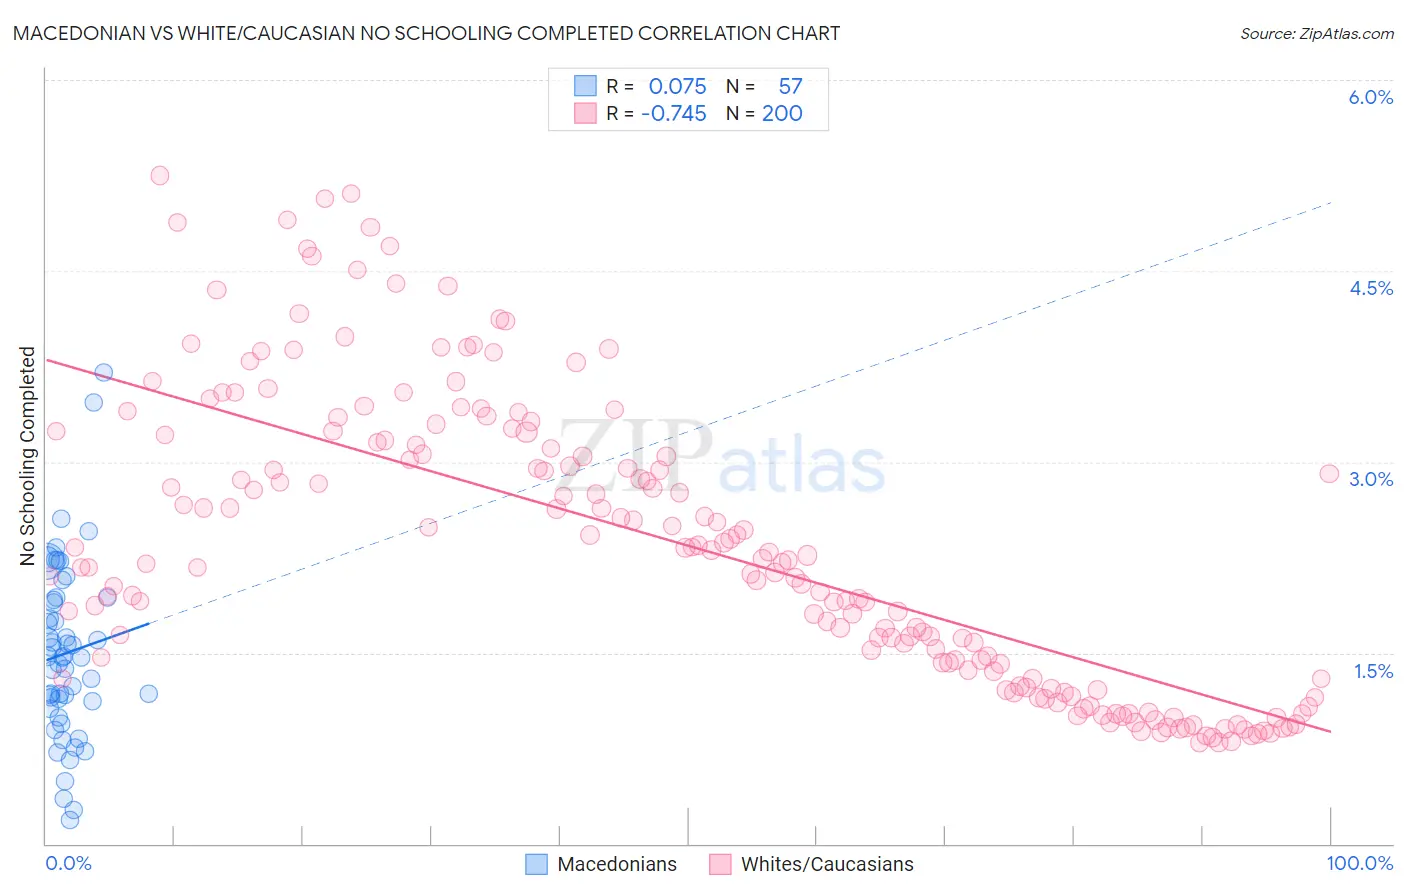
Macedonian vs White/Caucasian No Schooling Completed Correlation Chart
The statistical analysis conducted on geographies consisting of 131,792,248 people shows a slight positive correlation between the proportion of Macedonians and percentage of population with no schooling in the United States with a correlation coefficient (R) of 0.075 and weighted average of 1.7%. Similarly, the statistical analysis conducted on geographies consisting of 562,623,303 people shows a strong negative correlation between the proportion of Whites/Caucasians and percentage of population with no schooling in the United States with a correlation coefficient (R) of -0.745 and weighted average of 1.6%, a difference of 7.0%.
No Schooling Completed Correlation Summary
| Measurement | Macedonian | White/Caucasian |
| Minimum | 0.19% | 0.80% |
| Maximum | 3.7% | 5.2% |
| Range | 3.5% | 4.5% |
| Mean | 1.5% | 2.3% |
| Median | 1.5% | 2.2% |
| Interquartile 25% (IQ1) | 1.1% | 1.3% |
| Interquartile 75% (IQ3) | 1.9% | 3.2% |
| Interquartile Range (IQR) | 0.83% | 1.9% |
| Standard Deviation (Sample) | 0.69% | 1.1% |
| Standard Deviation (Population) | 0.69% | 1.1% |
Similar Demographics by No Schooling Completed
Demographics Similar to Macedonians by No Schooling Completed
In terms of no schooling completed, the demographic groups most similar to Macedonians are Cypriot (1.7%, a difference of 0.010%), Icelander (1.7%, a difference of 0.050%), Delaware (1.7%, a difference of 0.080%), Immigrants from Sweden (1.7%, a difference of 0.12%), and Immigrants from South Africa (1.7%, a difference of 0.14%).
| Demographics | Rating | Rank | No Schooling Completed |
| Cajuns | 99.5 /100 | #72 | Exceptional 1.7% |
| Immigrants | India | 99.4 /100 | #73 | Exceptional 1.7% |
| Zimbabweans | 99.4 /100 | #74 | Exceptional 1.7% |
| Immigrants | Belgium | 99.3 /100 | #75 | Exceptional 1.7% |
| Cherokee | 99.3 /100 | #76 | Exceptional 1.7% |
| Immigrants | Sweden | 99.3 /100 | #77 | Exceptional 1.7% |
| Delaware | 99.3 /100 | #78 | Exceptional 1.7% |
| Macedonians | 99.3 /100 | #79 | Exceptional 1.7% |
| Cypriots | 99.3 /100 | #80 | Exceptional 1.7% |
| Icelanders | 99.3 /100 | #81 | Exceptional 1.7% |
| Immigrants | South Africa | 99.3 /100 | #82 | Exceptional 1.7% |
| Potawatomi | 99.3 /100 | #83 | Exceptional 1.7% |
| Immigrants | Denmark | 99.2 /100 | #84 | Exceptional 1.7% |
| Immigrants | Australia | 99.2 /100 | #85 | Exceptional 1.7% |
| Ukrainians | 99.2 /100 | #86 | Exceptional 1.8% |
Demographics Similar to Whites/Caucasians by No Schooling Completed
In terms of no schooling completed, the demographic groups most similar to Whites/Caucasians are Immigrants from Scotland (1.6%, a difference of 0.060%), Celtic (1.6%, a difference of 0.13%), Ottawa (1.6%, a difference of 0.31%), Chippewa (1.6%, a difference of 0.34%), and Immigrants from Canada (1.6%, a difference of 0.41%).
| Demographics | Rating | Rank | No Schooling Completed |
| Bulgarians | 99.9 /100 | #42 | Exceptional 1.6% |
| Australians | 99.9 /100 | #43 | Exceptional 1.6% |
| Estonians | 99.9 /100 | #44 | Exceptional 1.6% |
| Czechoslovakians | 99.9 /100 | #45 | Exceptional 1.6% |
| Maltese | 99.9 /100 | #46 | Exceptional 1.6% |
| Ottawa | 99.9 /100 | #47 | Exceptional 1.6% |
| Immigrants | Scotland | 99.9 /100 | #48 | Exceptional 1.6% |
| Whites/Caucasians | 99.9 /100 | #49 | Exceptional 1.6% |
| Celtics | 99.9 /100 | #50 | Exceptional 1.6% |
| Chippewa | 99.8 /100 | #51 | Exceptional 1.6% |
| Immigrants | Canada | 99.8 /100 | #52 | Exceptional 1.6% |
| Creek | 99.8 /100 | #53 | Exceptional 1.6% |
| Crow | 99.8 /100 | #54 | Exceptional 1.6% |
| Greeks | 99.8 /100 | #55 | Exceptional 1.6% |
| Immigrants | North America | 99.8 /100 | #56 | Exceptional 1.6% |