Immigrants from South Central Asia vs White/Caucasian Male Disability
COMPARE
Immigrants from South Central Asia
White/Caucasian
Male Disability
Male Disability Comparison
Immigrants from South Central Asia
Whites/Caucasians
9.4%
MALE DISABILITY
100.0/ 100
METRIC RATING
6th/ 347
METRIC RANK
12.8%
MALE DISABILITY
0.0/ 100
METRIC RATING
291st/ 347
METRIC RANK
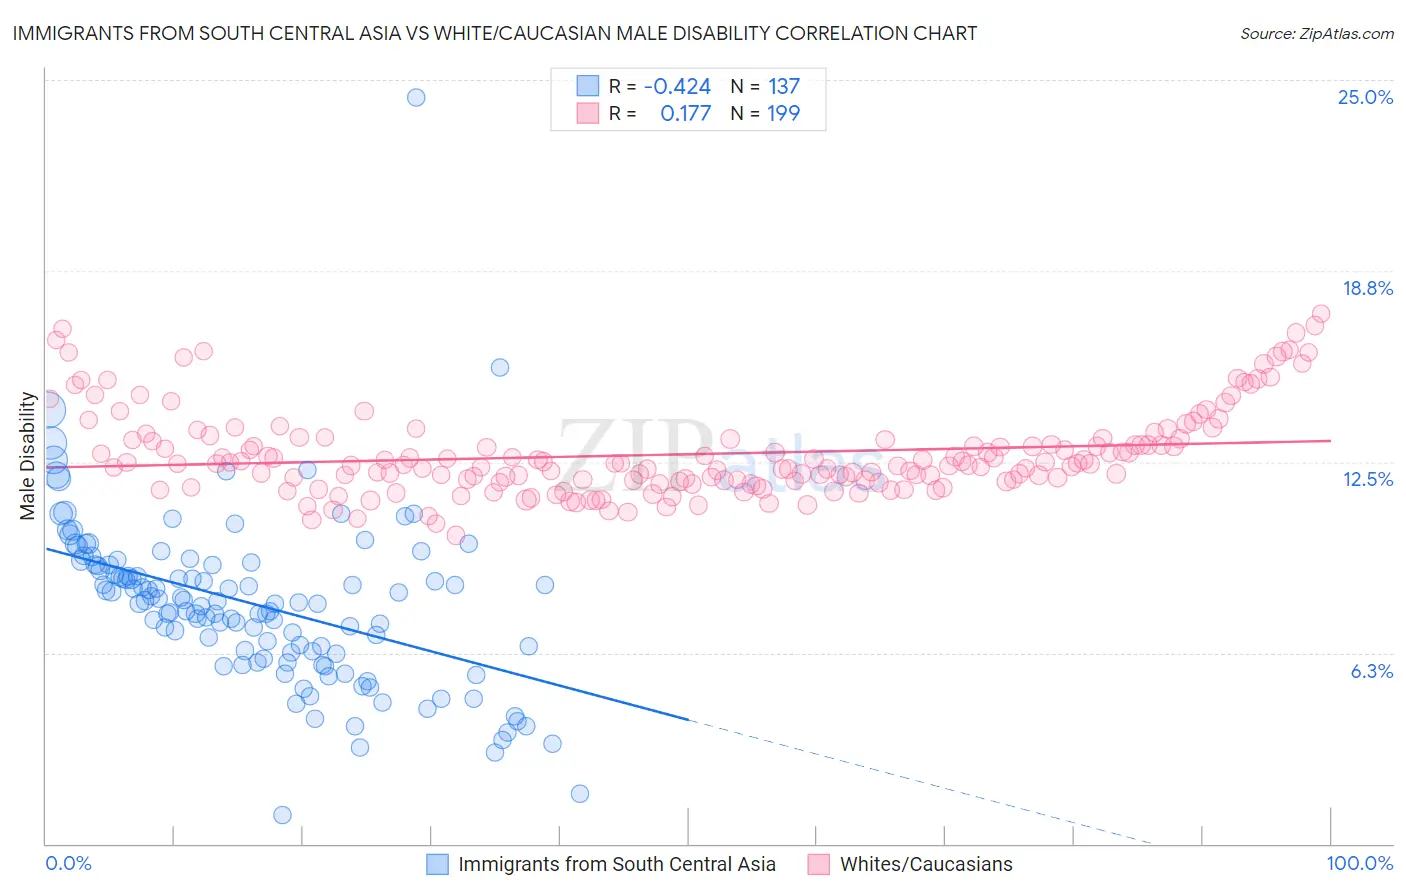
Immigrants from South Central Asia vs White/Caucasian Male Disability Correlation Chart
The statistical analysis conducted on geographies consisting of 473,016,937 people shows a moderate negative correlation between the proportion of Immigrants from South Central Asia and percentage of males with a disability in the United States with a correlation coefficient (R) of -0.424 and weighted average of 9.4%. Similarly, the statistical analysis conducted on geographies consisting of 582,973,983 people shows a poor positive correlation between the proportion of Whites/Caucasians and percentage of males with a disability in the United States with a correlation coefficient (R) of 0.177 and weighted average of 12.8%, a difference of 36.2%.
Male Disability Correlation Summary
| Measurement | Immigrants from South Central Asia | White/Caucasian |
| Minimum | 0.93% | 10.1% |
| Maximum | 24.4% | 17.4% |
| Range | 23.5% | 7.3% |
| Mean | 7.8% | 12.7% |
| Median | 7.9% | 12.4% |
| Interquartile 25% (IQ1) | 6.2% | 11.9% |
| Interquartile 75% (IQ3) | 9.1% | 13.2% |
| Interquartile Range (IQR) | 2.9% | 1.4% |
| Standard Deviation (Sample) | 2.8% | 1.4% |
| Standard Deviation (Population) | 2.8% | 1.4% |
Similar Demographics by Male Disability
Demographics Similar to Immigrants from South Central Asia by Male Disability
In terms of male disability, the demographic groups most similar to Immigrants from South Central Asia are Immigrants from Hong Kong (9.4%, a difference of 0.060%), Immigrants from Bolivia (9.5%, a difference of 0.33%), Immigrants from China (9.5%, a difference of 0.93%), Immigrants from Singapore (9.5%, a difference of 1.0%), and Immigrants from Israel (9.6%, a difference of 1.4%).
| Demographics | Rating | Rank | Male Disability |
| Immigrants | India | 100.0 /100 | #1 | Exceptional 9.0% |
| Immigrants | Taiwan | 100.0 /100 | #2 | Exceptional 9.1% |
| Filipinos | 100.0 /100 | #3 | Exceptional 9.1% |
| Thais | 100.0 /100 | #4 | Exceptional 9.2% |
| Immigrants | Hong Kong | 100.0 /100 | #5 | Exceptional 9.4% |
| Immigrants | South Central Asia | 100.0 /100 | #6 | Exceptional 9.4% |
| Immigrants | Bolivia | 100.0 /100 | #7 | Exceptional 9.5% |
| Immigrants | China | 100.0 /100 | #8 | Exceptional 9.5% |
| Immigrants | Singapore | 100.0 /100 | #9 | Exceptional 9.5% |
| Immigrants | Israel | 100.0 /100 | #10 | Exceptional 9.6% |
| Immigrants | Eastern Asia | 100.0 /100 | #11 | Exceptional 9.6% |
| Bolivians | 100.0 /100 | #12 | Exceptional 9.6% |
| Iranians | 100.0 /100 | #13 | Exceptional 9.7% |
| Immigrants | Iran | 100.0 /100 | #14 | Exceptional 9.7% |
| Indians (Asian) | 100.0 /100 | #15 | Exceptional 9.7% |
Demographics Similar to Whites/Caucasians by Male Disability
In terms of male disability, the demographic groups most similar to Whites/Caucasians are English (12.8%, a difference of 0.060%), Pima (12.8%, a difference of 0.090%), Immigrants from Cabo Verde (12.8%, a difference of 0.24%), Yaqui (12.9%, a difference of 0.34%), and Yup'ik (12.8%, a difference of 0.43%).
| Demographics | Rating | Rank | Male Disability |
| Spanish | 0.0 /100 | #284 | Tragic 12.7% |
| Welsh | 0.0 /100 | #285 | Tragic 12.7% |
| Scottish | 0.0 /100 | #286 | Tragic 12.8% |
| Cape Verdeans | 0.0 /100 | #287 | Tragic 12.8% |
| Yup'ik | 0.0 /100 | #288 | Tragic 12.8% |
| Immigrants | Cabo Verde | 0.0 /100 | #289 | Tragic 12.8% |
| Pima | 0.0 /100 | #290 | Tragic 12.8% |
| Whites/Caucasians | 0.0 /100 | #291 | Tragic 12.8% |
| English | 0.0 /100 | #292 | Tragic 12.8% |
| Yaqui | 0.0 /100 | #293 | Tragic 12.9% |
| Marshallese | 0.0 /100 | #294 | Tragic 12.9% |
| Immigrants | Micronesia | 0.0 /100 | #295 | Tragic 12.9% |
| Immigrants | Nonimmigrants | 0.0 /100 | #296 | Tragic 12.9% |
| Inupiat | 0.0 /100 | #297 | Tragic 13.0% |
| Pennsylvania Germans | 0.0 /100 | #298 | Tragic 13.0% |