Lithuanian vs Slavic Disability Age 5 to 17
COMPARE
Lithuanian
Slavic
Disability Age 5 to 17
Disability Age 5 to 17 Comparison
Lithuanians
Slavs
5.8%
DISABILITY AGE 5 TO 17
6.7/ 100
METRIC RATING
221st/ 347
METRIC RANK
5.9%
DISABILITY AGE 5 TO 17
0.9/ 100
METRIC RATING
259th/ 347
METRIC RANK
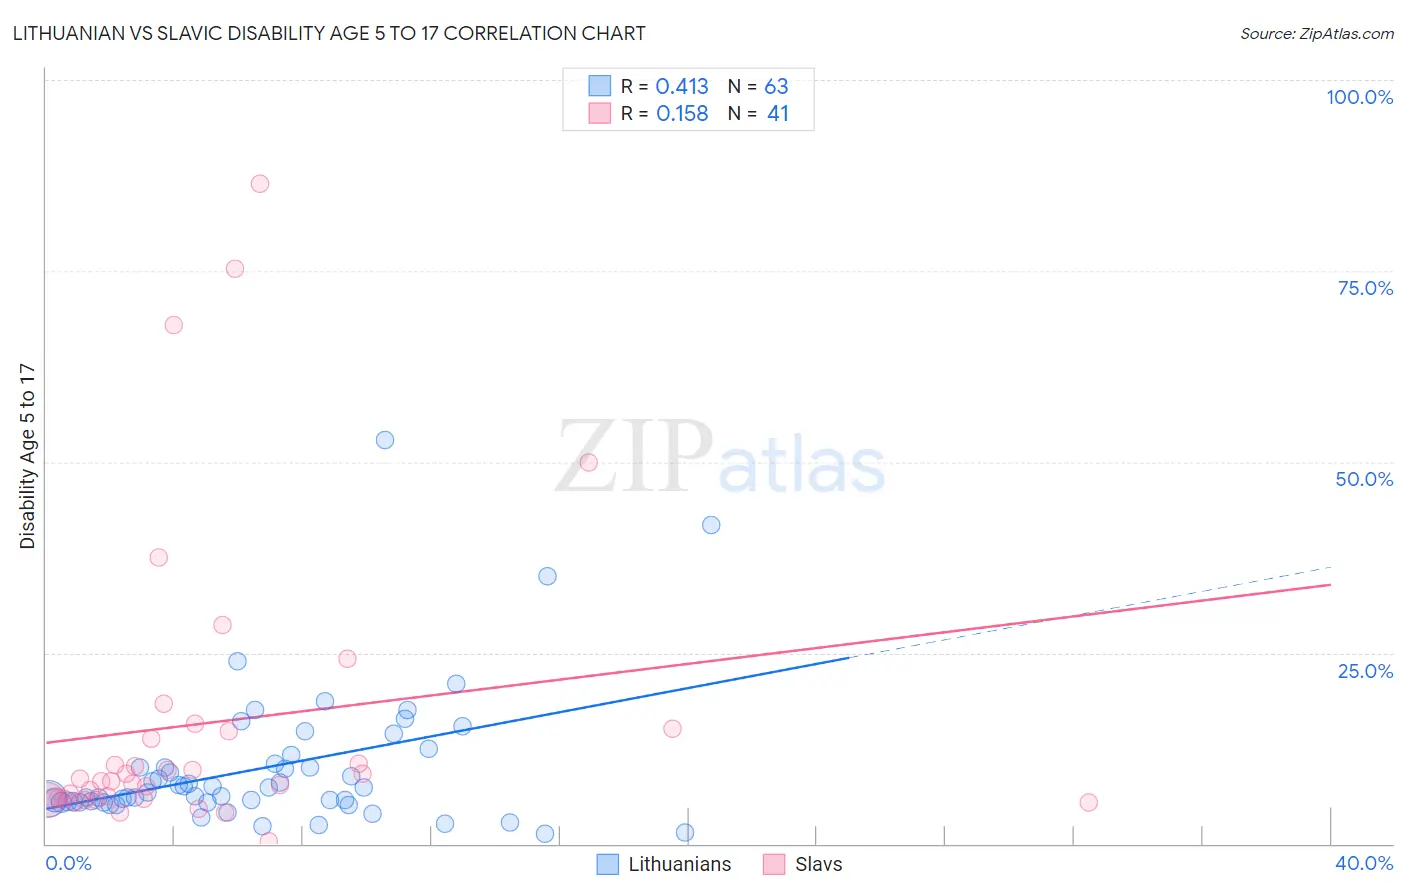
Lithuanian vs Slavic Disability Age 5 to 17 Correlation Chart
The statistical analysis conducted on geographies consisting of 416,867,041 people shows a moderate positive correlation between the proportion of Lithuanians and percentage of population with a disability between the ages 5 and 17 in the United States with a correlation coefficient (R) of 0.413 and weighted average of 5.8%. Similarly, the statistical analysis conducted on geographies consisting of 269,139,689 people shows a poor positive correlation between the proportion of Slavs and percentage of population with a disability between the ages 5 and 17 in the United States with a correlation coefficient (R) of 0.158 and weighted average of 5.9%, a difference of 2.5%.
Disability Age 5 to 17 Correlation Summary
| Measurement | Lithuanian | Slavic |
| Minimum | 1.4% | 0.37% |
| Maximum | 52.9% | 86.4% |
| Range | 51.6% | 86.0% |
| Mean | 9.9% | 15.8% |
| Median | 6.7% | 8.3% |
| Interquartile 25% (IQ1) | 5.4% | 5.9% |
| Interquartile 75% (IQ3) | 10.5% | 14.8% |
| Interquartile Range (IQR) | 5.0% | 8.9% |
| Standard Deviation (Sample) | 9.1% | 19.7% |
| Standard Deviation (Population) | 9.0% | 19.5% |
Similar Demographics by Disability Age 5 to 17
Demographics Similar to Lithuanians by Disability Age 5 to 17
In terms of disability age 5 to 17, the demographic groups most similar to Lithuanians are Immigrants from Sudan (5.8%, a difference of 0.0%), Belgian (5.8%, a difference of 0.040%), Sierra Leonean (5.8%, a difference of 0.050%), Immigrants from Sierra Leone (5.8%, a difference of 0.070%), and Czech (5.8%, a difference of 0.12%).
| Demographics | Rating | Rank | Disability Age 5 to 17 |
| Immigrants | Morocco | 8.3 /100 | #214 | Tragic 5.8% |
| Swedes | 8.1 /100 | #215 | Tragic 5.8% |
| Nigerians | 7.5 /100 | #216 | Tragic 5.8% |
| Czechs | 7.4 /100 | #217 | Tragic 5.8% |
| Immigrants | Sierra Leone | 7.1 /100 | #218 | Tragic 5.8% |
| Sierra Leoneans | 7.0 /100 | #219 | Tragic 5.8% |
| Belgians | 6.9 /100 | #220 | Tragic 5.8% |
| Lithuanians | 6.7 /100 | #221 | Tragic 5.8% |
| Immigrants | Sudan | 6.7 /100 | #222 | Tragic 5.8% |
| Alsatians | 6.0 /100 | #223 | Tragic 5.8% |
| Mexicans | 5.7 /100 | #224 | Tragic 5.8% |
| Guamanians/Chamorros | 5.6 /100 | #225 | Tragic 5.8% |
| British West Indians | 5.4 /100 | #226 | Tragic 5.8% |
| Swiss | 5.1 /100 | #227 | Tragic 5.8% |
| Haitians | 4.8 /100 | #228 | Tragic 5.8% |
Demographics Similar to Slavs by Disability Age 5 to 17
In terms of disability age 5 to 17, the demographic groups most similar to Slavs are Brazilian (5.9%, a difference of 0.060%), Hispanic or Latino (5.9%, a difference of 0.090%), Somali (5.9%, a difference of 0.13%), Hopi (5.9%, a difference of 0.18%), and Immigrants from Middle Africa (5.9%, a difference of 0.20%).
| Demographics | Rating | Rank | Disability Age 5 to 17 |
| Hondurans | 1.5 /100 | #252 | Tragic 5.9% |
| Scandinavians | 1.4 /100 | #253 | Tragic 5.9% |
| Barbadians | 1.3 /100 | #254 | Tragic 5.9% |
| Italians | 1.2 /100 | #255 | Tragic 5.9% |
| Hopi | 1.0 /100 | #256 | Tragic 5.9% |
| Hispanics or Latinos | 1.0 /100 | #257 | Tragic 5.9% |
| Brazilians | 0.9 /100 | #258 | Tragic 5.9% |
| Slavs | 0.9 /100 | #259 | Tragic 5.9% |
| Somalis | 0.8 /100 | #260 | Tragic 5.9% |
| Immigrants | Middle Africa | 0.7 /100 | #261 | Tragic 5.9% |
| Immigrants | Western Africa | 0.7 /100 | #262 | Tragic 5.9% |
| Czechoslovakians | 0.7 /100 | #263 | Tragic 5.9% |
| Canadians | 0.6 /100 | #264 | Tragic 6.0% |
| Panamanians | 0.6 /100 | #265 | Tragic 6.0% |
| Slovenes | 0.6 /100 | #266 | Tragic 6.0% |