Lithuanian vs Immigrants from Australia Disability Age 5 to 17
COMPARE
Lithuanian
Immigrants from Australia
Disability Age 5 to 17
Disability Age 5 to 17 Comparison
Lithuanians
Immigrants from Australia
5.8%
DISABILITY AGE 5 TO 17
6.7/ 100
METRIC RATING
221st/ 347
METRIC RANK
5.0%
DISABILITY AGE 5 TO 17
100.0/ 100
METRIC RATING
41st/ 347
METRIC RANK
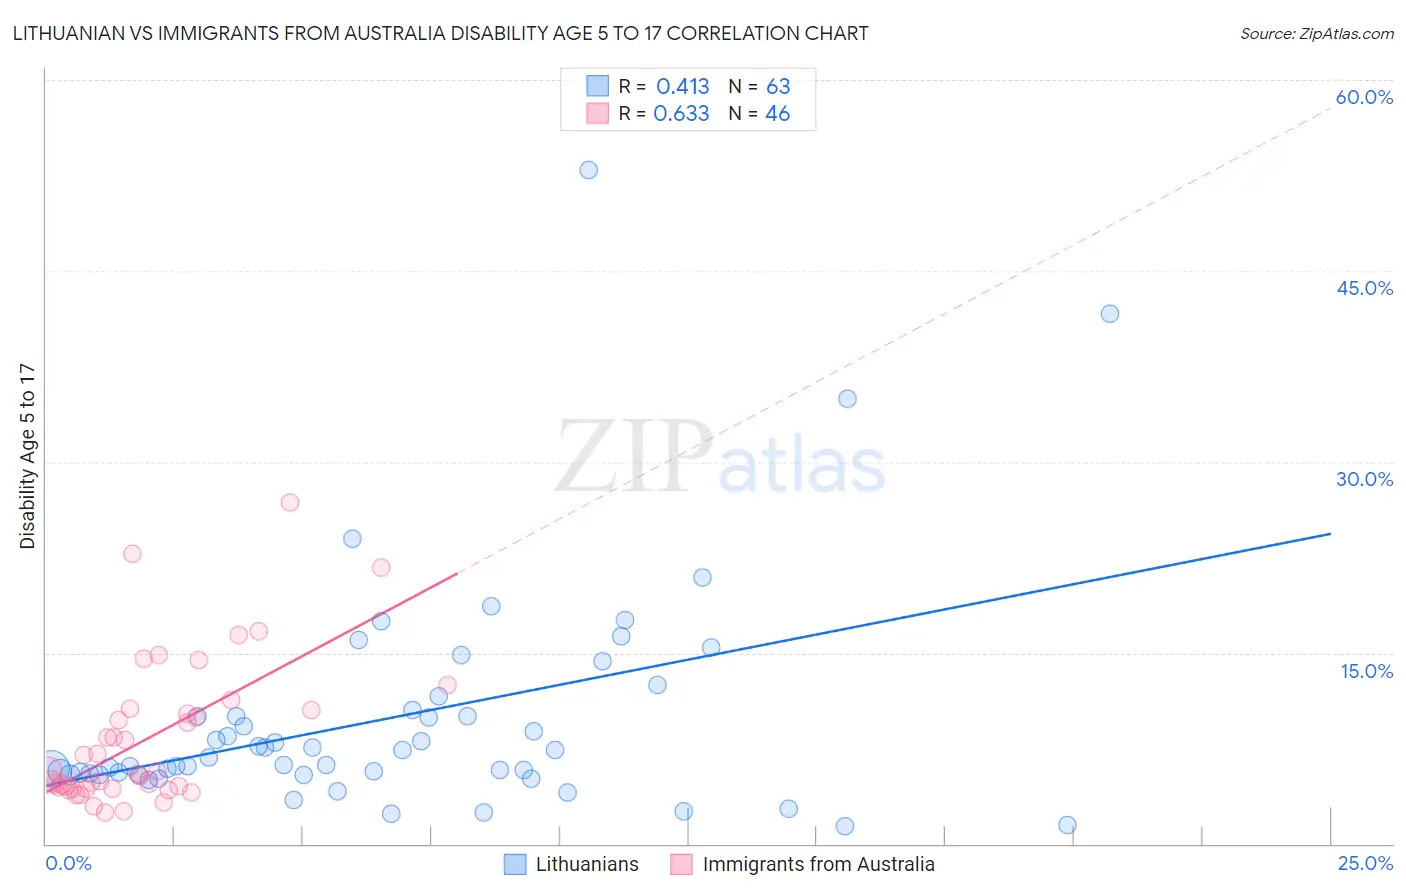
Lithuanian vs Immigrants from Australia Disability Age 5 to 17 Correlation Chart
The statistical analysis conducted on geographies consisting of 416,867,041 people shows a moderate positive correlation between the proportion of Lithuanians and percentage of population with a disability between the ages 5 and 17 in the United States with a correlation coefficient (R) of 0.413 and weighted average of 5.8%. Similarly, the statistical analysis conducted on geographies consisting of 226,040,529 people shows a significant positive correlation between the proportion of Immigrants from Australia and percentage of population with a disability between the ages 5 and 17 in the United States with a correlation coefficient (R) of 0.633 and weighted average of 5.0%, a difference of 15.2%.
Disability Age 5 to 17 Correlation Summary
| Measurement | Lithuanian | Immigrants from Australia |
| Minimum | 1.4% | 2.5% |
| Maximum | 52.9% | 26.8% |
| Range | 51.6% | 24.3% |
| Mean | 9.9% | 8.3% |
| Median | 6.7% | 5.6% |
| Interquartile 25% (IQ1) | 5.4% | 4.3% |
| Interquartile 75% (IQ3) | 10.5% | 10.5% |
| Interquartile Range (IQR) | 5.0% | 6.2% |
| Standard Deviation (Sample) | 9.1% | 5.7% |
| Standard Deviation (Population) | 9.0% | 5.6% |
Similar Demographics by Disability Age 5 to 17
Demographics Similar to Lithuanians by Disability Age 5 to 17
In terms of disability age 5 to 17, the demographic groups most similar to Lithuanians are Immigrants from Sudan (5.8%, a difference of 0.0%), Belgian (5.8%, a difference of 0.040%), Sierra Leonean (5.8%, a difference of 0.050%), Immigrants from Sierra Leone (5.8%, a difference of 0.070%), and Czech (5.8%, a difference of 0.12%).
| Demographics | Rating | Rank | Disability Age 5 to 17 |
| Immigrants | Morocco | 8.3 /100 | #214 | Tragic 5.8% |
| Swedes | 8.1 /100 | #215 | Tragic 5.8% |
| Nigerians | 7.5 /100 | #216 | Tragic 5.8% |
| Czechs | 7.4 /100 | #217 | Tragic 5.8% |
| Immigrants | Sierra Leone | 7.1 /100 | #218 | Tragic 5.8% |
| Sierra Leoneans | 7.0 /100 | #219 | Tragic 5.8% |
| Belgians | 6.9 /100 | #220 | Tragic 5.8% |
| Lithuanians | 6.7 /100 | #221 | Tragic 5.8% |
| Immigrants | Sudan | 6.7 /100 | #222 | Tragic 5.8% |
| Alsatians | 6.0 /100 | #223 | Tragic 5.8% |
| Mexicans | 5.7 /100 | #224 | Tragic 5.8% |
| Guamanians/Chamorros | 5.6 /100 | #225 | Tragic 5.8% |
| British West Indians | 5.4 /100 | #226 | Tragic 5.8% |
| Swiss | 5.1 /100 | #227 | Tragic 5.8% |
| Haitians | 4.8 /100 | #228 | Tragic 5.8% |
Demographics Similar to Immigrants from Australia by Disability Age 5 to 17
In terms of disability age 5 to 17, the demographic groups most similar to Immigrants from Australia are Immigrants from Sri Lanka (5.0%, a difference of 0.010%), Okinawan (5.0%, a difference of 0.080%), Immigrants from Philippines (5.0%, a difference of 0.16%), Immigrants from Argentina (5.0%, a difference of 0.16%), and Immigrants from Belarus (5.0%, a difference of 0.20%).
| Demographics | Rating | Rank | Disability Age 5 to 17 |
| Israelis | 100.0 /100 | #34 | Exceptional 5.0% |
| Bolivians | 100.0 /100 | #35 | Exceptional 5.0% |
| Immigrants | Egypt | 100.0 /100 | #36 | Exceptional 5.0% |
| Immigrants | Belarus | 100.0 /100 | #37 | Exceptional 5.0% |
| Immigrants | Philippines | 100.0 /100 | #38 | Exceptional 5.0% |
| Immigrants | Argentina | 100.0 /100 | #39 | Exceptional 5.0% |
| Okinawans | 100.0 /100 | #40 | Exceptional 5.0% |
| Immigrants | Australia | 100.0 /100 | #41 | Exceptional 5.0% |
| Immigrants | Sri Lanka | 100.0 /100 | #42 | Exceptional 5.0% |
| Immigrants | Russia | 100.0 /100 | #43 | Exceptional 5.0% |
| Egyptians | 100.0 /100 | #44 | Exceptional 5.0% |
| Tongans | 100.0 /100 | #45 | Exceptional 5.0% |
| Assyrians/Chaldeans/Syriacs | 100.0 /100 | #46 | Exceptional 5.0% |
| Vietnamese | 100.0 /100 | #47 | Exceptional 5.1% |
| Koreans | 100.0 /100 | #48 | Exceptional 5.1% |