Lithuanian vs Immigrants from Asia Disability Age 5 to 17
COMPARE
Lithuanian
Immigrants from Asia
Disability Age 5 to 17
Disability Age 5 to 17 Comparison
Lithuanians
Immigrants from Asia
5.8%
DISABILITY AGE 5 TO 17
6.7/ 100
METRIC RATING
221st/ 347
METRIC RANK
4.8%
DISABILITY AGE 5 TO 17
100.0/ 100
METRIC RATING
25th/ 347
METRIC RANK
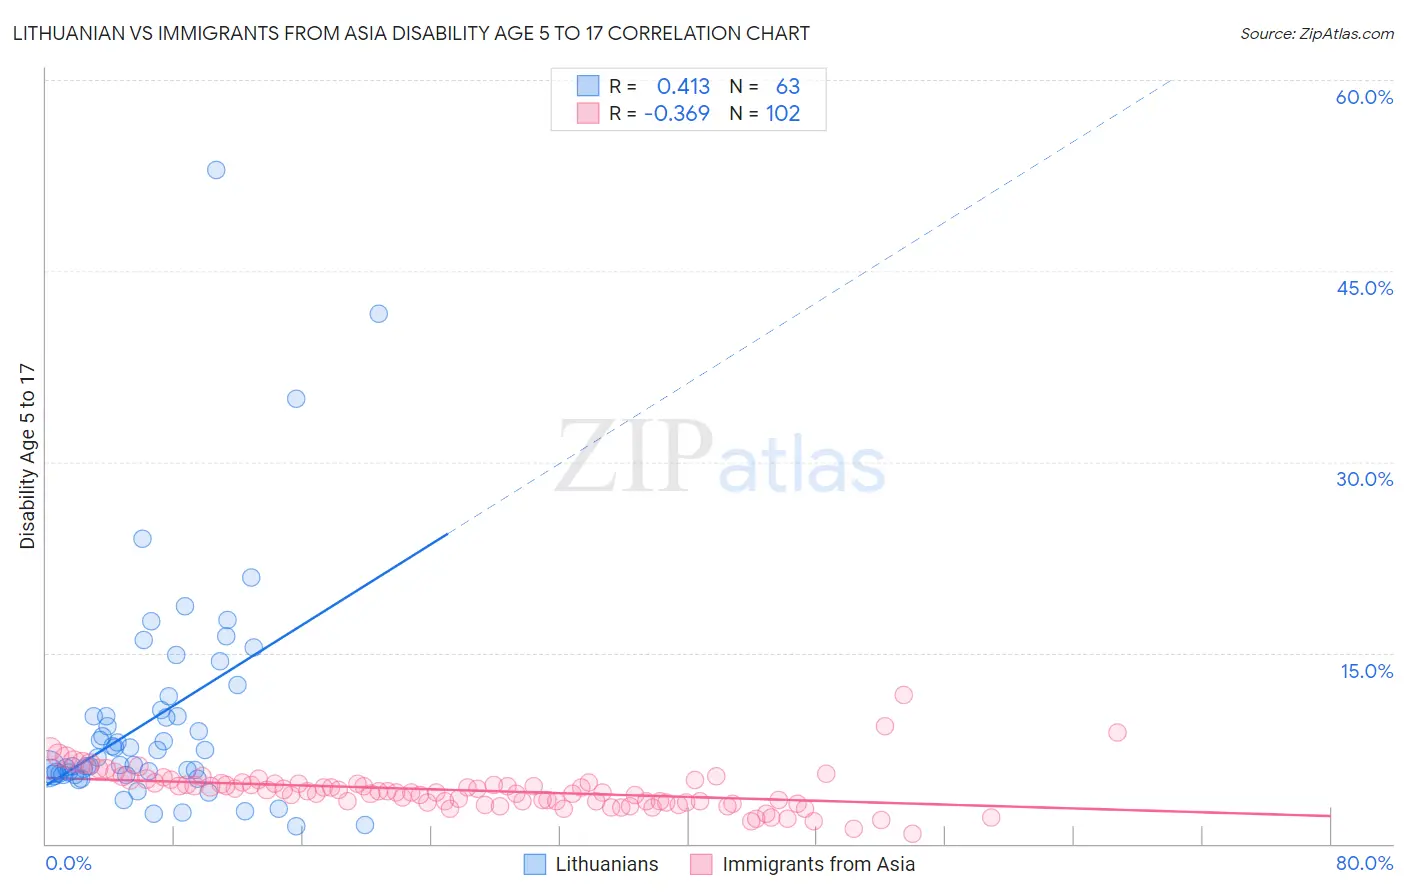
Lithuanian vs Immigrants from Asia Disability Age 5 to 17 Correlation Chart
The statistical analysis conducted on geographies consisting of 416,867,041 people shows a moderate positive correlation between the proportion of Lithuanians and percentage of population with a disability between the ages 5 and 17 in the United States with a correlation coefficient (R) of 0.413 and weighted average of 5.8%. Similarly, the statistical analysis conducted on geographies consisting of 539,214,409 people shows a mild negative correlation between the proportion of Immigrants from Asia and percentage of population with a disability between the ages 5 and 17 in the United States with a correlation coefficient (R) of -0.369 and weighted average of 4.8%, a difference of 19.2%.
Disability Age 5 to 17 Correlation Summary
| Measurement | Lithuanian | Immigrants from Asia |
| Minimum | 1.4% | 0.75% |
| Maximum | 52.9% | 11.7% |
| Range | 51.6% | 10.9% |
| Mean | 9.9% | 4.2% |
| Median | 6.7% | 4.1% |
| Interquartile 25% (IQ1) | 5.4% | 3.3% |
| Interquartile 75% (IQ3) | 10.5% | 4.8% |
| Interquartile Range (IQR) | 5.0% | 1.5% |
| Standard Deviation (Sample) | 9.1% | 1.6% |
| Standard Deviation (Population) | 9.0% | 1.6% |
Similar Demographics by Disability Age 5 to 17
Demographics Similar to Lithuanians by Disability Age 5 to 17
In terms of disability age 5 to 17, the demographic groups most similar to Lithuanians are Immigrants from Sudan (5.8%, a difference of 0.0%), Belgian (5.8%, a difference of 0.040%), Sierra Leonean (5.8%, a difference of 0.050%), Immigrants from Sierra Leone (5.8%, a difference of 0.070%), and Czech (5.8%, a difference of 0.12%).
| Demographics | Rating | Rank | Disability Age 5 to 17 |
| Immigrants | Morocco | 8.3 /100 | #214 | Tragic 5.8% |
| Swedes | 8.1 /100 | #215 | Tragic 5.8% |
| Nigerians | 7.5 /100 | #216 | Tragic 5.8% |
| Czechs | 7.4 /100 | #217 | Tragic 5.8% |
| Immigrants | Sierra Leone | 7.1 /100 | #218 | Tragic 5.8% |
| Sierra Leoneans | 7.0 /100 | #219 | Tragic 5.8% |
| Belgians | 6.9 /100 | #220 | Tragic 5.8% |
| Lithuanians | 6.7 /100 | #221 | Tragic 5.8% |
| Immigrants | Sudan | 6.7 /100 | #222 | Tragic 5.8% |
| Alsatians | 6.0 /100 | #223 | Tragic 5.8% |
| Mexicans | 5.7 /100 | #224 | Tragic 5.8% |
| Guamanians/Chamorros | 5.6 /100 | #225 | Tragic 5.8% |
| British West Indians | 5.4 /100 | #226 | Tragic 5.8% |
| Swiss | 5.1 /100 | #227 | Tragic 5.8% |
| Haitians | 4.8 /100 | #228 | Tragic 5.8% |
Demographics Similar to Immigrants from Asia by Disability Age 5 to 17
In terms of disability age 5 to 17, the demographic groups most similar to Immigrants from Asia are Immigrants from Lebanon (4.8%, a difference of 0.11%), Immigrants from Bolivia (4.8%, a difference of 0.26%), Bhutanese (4.9%, a difference of 0.87%), Asian (4.8%, a difference of 0.92%), and Yup'ik (4.8%, a difference of 1.3%).
| Demographics | Rating | Rank | Disability Age 5 to 17 |
| Immigrants | South Central Asia | 100.0 /100 | #18 | Exceptional 4.7% |
| Immigrants | Uzbekistan | 100.0 /100 | #19 | Exceptional 4.8% |
| Burmese | 100.0 /100 | #20 | Exceptional 4.8% |
| Yup'ik | 100.0 /100 | #21 | Exceptional 4.8% |
| Asians | 100.0 /100 | #22 | Exceptional 4.8% |
| Immigrants | Bolivia | 100.0 /100 | #23 | Exceptional 4.8% |
| Immigrants | Lebanon | 100.0 /100 | #24 | Exceptional 4.8% |
| Immigrants | Asia | 100.0 /100 | #25 | Exceptional 4.8% |
| Bhutanese | 100.0 /100 | #26 | Exceptional 4.9% |
| Taiwanese | 100.0 /100 | #27 | Exceptional 4.9% |
| Immigrants | Japan | 100.0 /100 | #28 | Exceptional 4.9% |
| Immigrants | Serbia | 100.0 /100 | #29 | Exceptional 4.9% |
| Immigrants | Malaysia | 100.0 /100 | #30 | Exceptional 5.0% |
| Immigrants | Pakistan | 100.0 /100 | #31 | Exceptional 5.0% |
| Soviet Union | 100.0 /100 | #32 | Exceptional 5.0% |