Venezuelan vs Slavic Disability Age 5 to 17
COMPARE
Venezuelan
Slavic
Disability Age 5 to 17
Disability Age 5 to 17 Comparison
Venezuelans
Slavs
5.4%
DISABILITY AGE 5 TO 17
92.7/ 100
METRIC RATING
133rd/ 347
METRIC RANK
5.9%
DISABILITY AGE 5 TO 17
0.9/ 100
METRIC RATING
259th/ 347
METRIC RANK
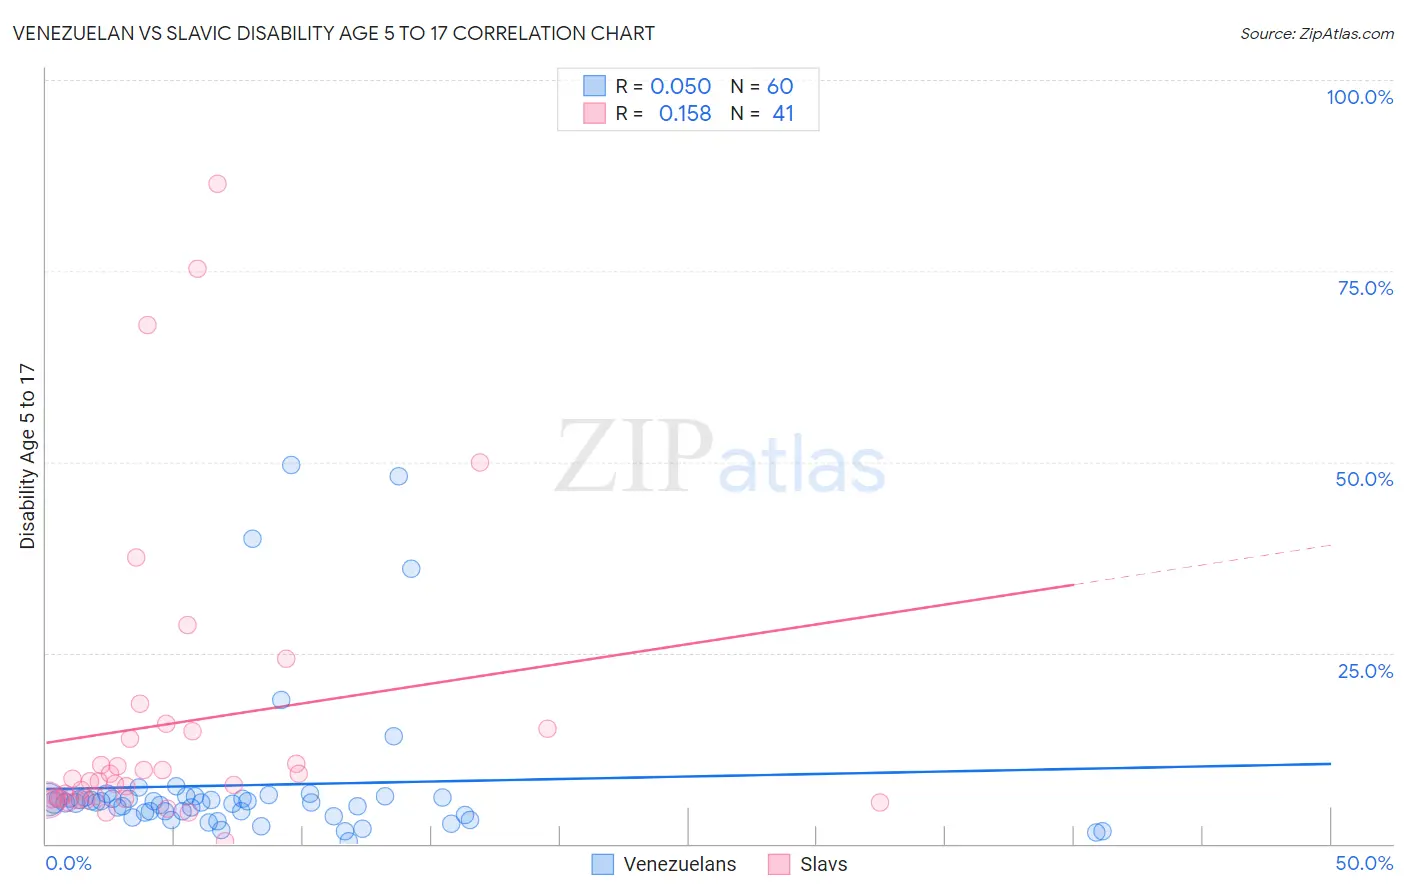
Venezuelan vs Slavic Disability Age 5 to 17 Correlation Chart
The statistical analysis conducted on geographies consisting of 304,670,804 people shows no correlation between the proportion of Venezuelans and percentage of population with a disability between the ages 5 and 17 in the United States with a correlation coefficient (R) of 0.050 and weighted average of 5.4%. Similarly, the statistical analysis conducted on geographies consisting of 269,139,689 people shows a poor positive correlation between the proportion of Slavs and percentage of population with a disability between the ages 5 and 17 in the United States with a correlation coefficient (R) of 0.158 and weighted average of 5.9%, a difference of 9.3%.
Disability Age 5 to 17 Correlation Summary
| Measurement | Venezuelan | Slavic |
| Minimum | 0.36% | 0.37% |
| Maximum | 49.6% | 86.4% |
| Range | 49.2% | 86.0% |
| Mean | 7.7% | 15.8% |
| Median | 5.4% | 8.3% |
| Interquartile 25% (IQ1) | 3.9% | 5.9% |
| Interquartile 75% (IQ3) | 6.1% | 14.8% |
| Interquartile Range (IQR) | 2.2% | 8.9% |
| Standard Deviation (Sample) | 10.1% | 19.7% |
| Standard Deviation (Population) | 10.0% | 19.5% |
Similar Demographics by Disability Age 5 to 17
Demographics Similar to Venezuelans by Disability Age 5 to 17
In terms of disability age 5 to 17, the demographic groups most similar to Venezuelans are Immigrants from Colombia (5.4%, a difference of 0.030%), Arab (5.4%, a difference of 0.050%), Yuman (5.4%, a difference of 0.080%), Immigrants from Belize (5.4%, a difference of 0.17%), and Immigrants from Denmark (5.4%, a difference of 0.22%).
| Demographics | Rating | Rank | Disability Age 5 to 17 |
| New Zealanders | 95.0 /100 | #126 | Exceptional 5.4% |
| Latvians | 95.0 /100 | #127 | Exceptional 5.4% |
| Immigrants | Venezuela | 94.5 /100 | #128 | Exceptional 5.4% |
| Romanians | 94.1 /100 | #129 | Exceptional 5.4% |
| Immigrants | Bulgaria | 94.0 /100 | #130 | Exceptional 5.4% |
| Arabs | 92.9 /100 | #131 | Exceptional 5.4% |
| Immigrants | Colombia | 92.9 /100 | #132 | Exceptional 5.4% |
| Venezuelans | 92.7 /100 | #133 | Exceptional 5.4% |
| Yuman | 92.3 /100 | #134 | Exceptional 5.4% |
| Immigrants | Belize | 91.7 /100 | #135 | Exceptional 5.4% |
| Immigrants | Denmark | 91.4 /100 | #136 | Exceptional 5.4% |
| Navajo | 90.9 /100 | #137 | Exceptional 5.4% |
| Immigrants | Oceania | 90.8 /100 | #138 | Exceptional 5.4% |
| Belizeans | 90.8 /100 | #139 | Exceptional 5.4% |
| Immigrants | Netherlands | 90.5 /100 | #140 | Exceptional 5.4% |
Demographics Similar to Slavs by Disability Age 5 to 17
In terms of disability age 5 to 17, the demographic groups most similar to Slavs are Brazilian (5.9%, a difference of 0.060%), Hispanic or Latino (5.9%, a difference of 0.090%), Somali (5.9%, a difference of 0.13%), Hopi (5.9%, a difference of 0.18%), and Immigrants from Middle Africa (5.9%, a difference of 0.20%).
| Demographics | Rating | Rank | Disability Age 5 to 17 |
| Hondurans | 1.5 /100 | #252 | Tragic 5.9% |
| Scandinavians | 1.4 /100 | #253 | Tragic 5.9% |
| Barbadians | 1.3 /100 | #254 | Tragic 5.9% |
| Italians | 1.2 /100 | #255 | Tragic 5.9% |
| Hopi | 1.0 /100 | #256 | Tragic 5.9% |
| Hispanics or Latinos | 1.0 /100 | #257 | Tragic 5.9% |
| Brazilians | 0.9 /100 | #258 | Tragic 5.9% |
| Slavs | 0.9 /100 | #259 | Tragic 5.9% |
| Somalis | 0.8 /100 | #260 | Tragic 5.9% |
| Immigrants | Middle Africa | 0.7 /100 | #261 | Tragic 5.9% |
| Immigrants | Western Africa | 0.7 /100 | #262 | Tragic 5.9% |
| Czechoslovakians | 0.7 /100 | #263 | Tragic 5.9% |
| Canadians | 0.6 /100 | #264 | Tragic 6.0% |
| Panamanians | 0.6 /100 | #265 | Tragic 6.0% |
| Slovenes | 0.6 /100 | #266 | Tragic 6.0% |