Iroquois vs Slavic Disability Age 5 to 17
COMPARE
Iroquois
Slavic
Disability Age 5 to 17
Disability Age 5 to 17 Comparison
Iroquois
Slavs
6.9%
DISABILITY AGE 5 TO 17
0.0/ 100
METRIC RATING
338th/ 347
METRIC RANK
5.9%
DISABILITY AGE 5 TO 17
0.9/ 100
METRIC RATING
259th/ 347
METRIC RANK
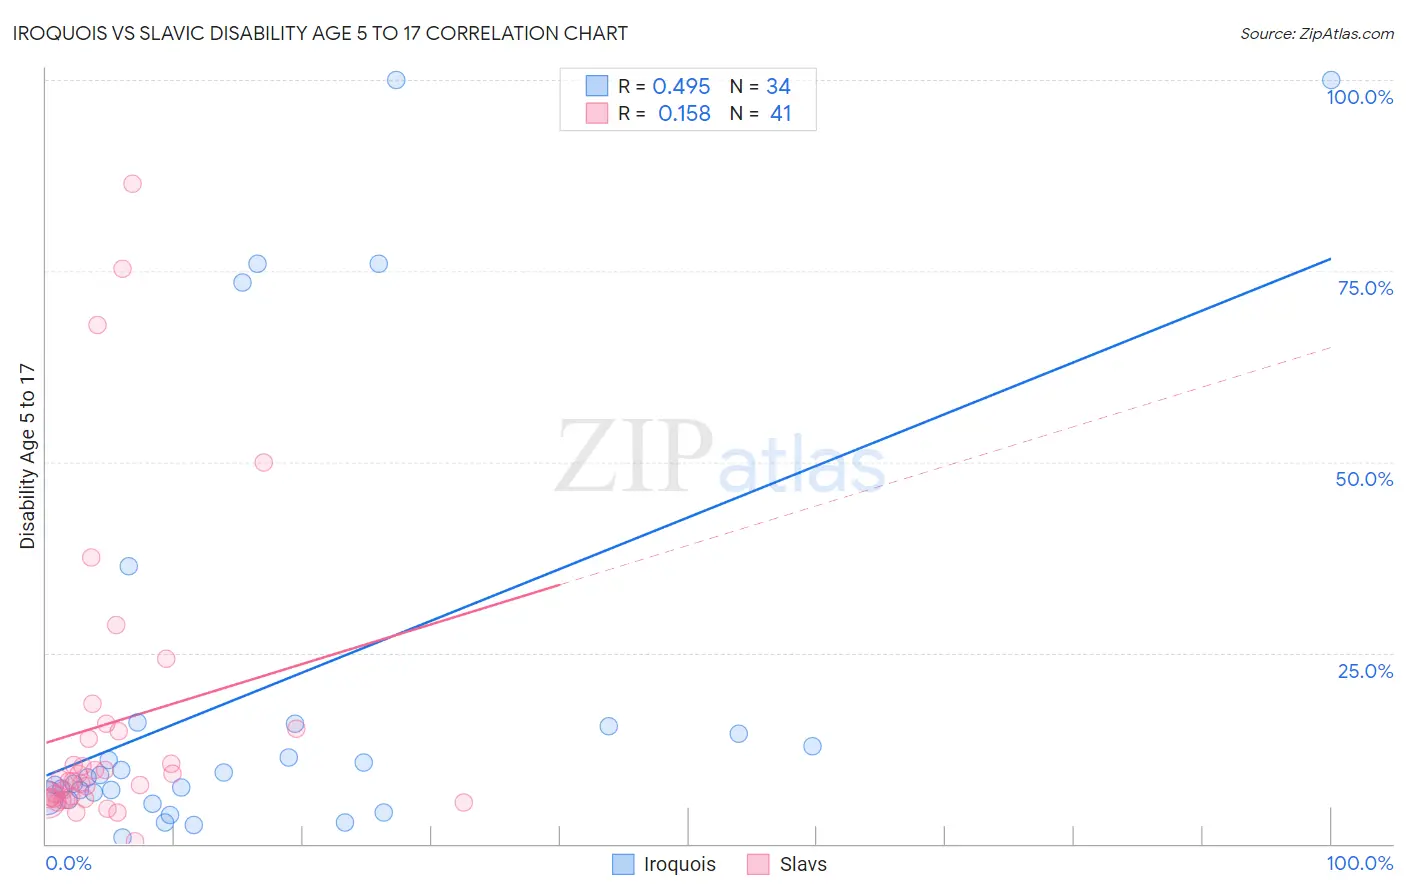
Iroquois vs Slavic Disability Age 5 to 17 Correlation Chart
The statistical analysis conducted on geographies consisting of 206,302,830 people shows a moderate positive correlation between the proportion of Iroquois and percentage of population with a disability between the ages 5 and 17 in the United States with a correlation coefficient (R) of 0.495 and weighted average of 6.9%. Similarly, the statistical analysis conducted on geographies consisting of 269,139,689 people shows a poor positive correlation between the proportion of Slavs and percentage of population with a disability between the ages 5 and 17 in the United States with a correlation coefficient (R) of 0.158 and weighted average of 5.9%, a difference of 16.2%.
Disability Age 5 to 17 Correlation Summary
| Measurement | Iroquois | Slavic |
| Minimum | 0.85% | 0.37% |
| Maximum | 100.0% | 86.4% |
| Range | 99.1% | 86.0% |
| Mean | 20.3% | 15.8% |
| Median | 8.9% | 8.3% |
| Interquartile 25% (IQ1) | 6.0% | 5.9% |
| Interquartile 75% (IQ3) | 15.4% | 14.8% |
| Interquartile Range (IQR) | 9.3% | 8.9% |
| Standard Deviation (Sample) | 28.4% | 19.7% |
| Standard Deviation (Population) | 28.0% | 19.5% |
Similar Demographics by Disability Age 5 to 17
Demographics Similar to Iroquois by Disability Age 5 to 17
In terms of disability age 5 to 17, the demographic groups most similar to Iroquois are Creek (6.9%, a difference of 0.24%), Choctaw (6.9%, a difference of 0.33%), Cherokee (6.9%, a difference of 0.59%), Chickasaw (6.8%, a difference of 0.68%), and Cape Verdean (7.0%, a difference of 1.1%).
| Demographics | Rating | Rank | Disability Age 5 to 17 |
| French Canadians | 0.0 /100 | #331 | Tragic 6.7% |
| Immigrants | Azores | 0.0 /100 | #332 | Tragic 6.7% |
| Blacks/African Americans | 0.0 /100 | #333 | Tragic 6.8% |
| Seminole | 0.0 /100 | #334 | Tragic 6.8% |
| Ottawa | 0.0 /100 | #335 | Tragic 6.8% |
| Chickasaw | 0.0 /100 | #336 | Tragic 6.8% |
| Creek | 0.0 /100 | #337 | Tragic 6.9% |
| Iroquois | 0.0 /100 | #338 | Tragic 6.9% |
| Choctaw | 0.0 /100 | #339 | Tragic 6.9% |
| Cherokee | 0.0 /100 | #340 | Tragic 6.9% |
| Cape Verdeans | 0.0 /100 | #341 | Tragic 7.0% |
| Chippewa | 0.0 /100 | #342 | Tragic 7.1% |
| Immigrants | Cabo Verde | 0.0 /100 | #343 | Tragic 7.1% |
| Cajuns | 0.0 /100 | #344 | Tragic 7.2% |
| Tsimshian | 0.0 /100 | #345 | Tragic 7.9% |
Demographics Similar to Slavs by Disability Age 5 to 17
In terms of disability age 5 to 17, the demographic groups most similar to Slavs are Brazilian (5.9%, a difference of 0.060%), Hispanic or Latino (5.9%, a difference of 0.090%), Somali (5.9%, a difference of 0.13%), Hopi (5.9%, a difference of 0.18%), and Immigrants from Middle Africa (5.9%, a difference of 0.20%).
| Demographics | Rating | Rank | Disability Age 5 to 17 |
| Hondurans | 1.5 /100 | #252 | Tragic 5.9% |
| Scandinavians | 1.4 /100 | #253 | Tragic 5.9% |
| Barbadians | 1.3 /100 | #254 | Tragic 5.9% |
| Italians | 1.2 /100 | #255 | Tragic 5.9% |
| Hopi | 1.0 /100 | #256 | Tragic 5.9% |
| Hispanics or Latinos | 1.0 /100 | #257 | Tragic 5.9% |
| Brazilians | 0.9 /100 | #258 | Tragic 5.9% |
| Slavs | 0.9 /100 | #259 | Tragic 5.9% |
| Somalis | 0.8 /100 | #260 | Tragic 5.9% |
| Immigrants | Middle Africa | 0.7 /100 | #261 | Tragic 5.9% |
| Immigrants | Western Africa | 0.7 /100 | #262 | Tragic 5.9% |
| Czechoslovakians | 0.7 /100 | #263 | Tragic 5.9% |
| Canadians | 0.6 /100 | #264 | Tragic 6.0% |
| Panamanians | 0.6 /100 | #265 | Tragic 6.0% |
| Slovenes | 0.6 /100 | #266 | Tragic 6.0% |