Immigrants from Jordan vs Slavic Disability Age 5 to 17
COMPARE
Immigrants from Jordan
Slavic
Disability Age 5 to 17
Disability Age 5 to 17 Comparison
Immigrants from Jordan
Slavs
5.3%
DISABILITY AGE 5 TO 17
99.1/ 100
METRIC RATING
94th/ 347
METRIC RANK
5.9%
DISABILITY AGE 5 TO 17
0.9/ 100
METRIC RATING
259th/ 347
METRIC RANK
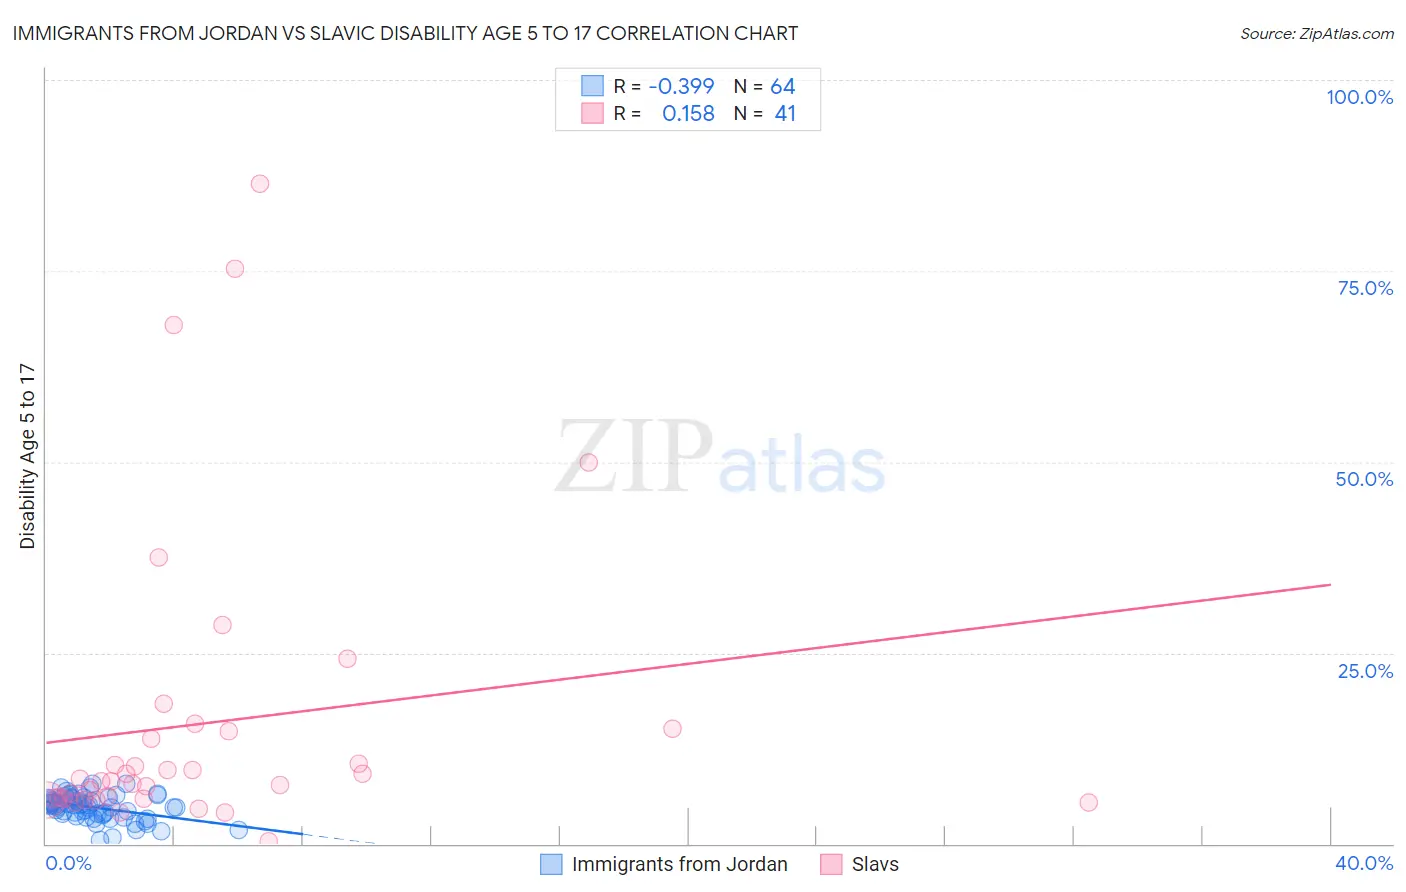
Immigrants from Jordan vs Slavic Disability Age 5 to 17 Correlation Chart
The statistical analysis conducted on geographies consisting of 180,773,997 people shows a mild negative correlation between the proportion of Immigrants from Jordan and percentage of population with a disability between the ages 5 and 17 in the United States with a correlation coefficient (R) of -0.399 and weighted average of 5.3%. Similarly, the statistical analysis conducted on geographies consisting of 269,139,689 people shows a poor positive correlation between the proportion of Slavs and percentage of population with a disability between the ages 5 and 17 in the United States with a correlation coefficient (R) of 0.158 and weighted average of 5.9%, a difference of 12.3%.
Disability Age 5 to 17 Correlation Summary
| Measurement | Immigrants from Jordan | Slavic |
| Minimum | 0.46% | 0.37% |
| Maximum | 7.9% | 86.4% |
| Range | 7.4% | 86.0% |
| Mean | 4.7% | 15.8% |
| Median | 5.0% | 8.3% |
| Interquartile 25% (IQ1) | 3.8% | 5.9% |
| Interquartile 75% (IQ3) | 5.9% | 14.8% |
| Interquartile Range (IQR) | 2.1% | 8.9% |
| Standard Deviation (Sample) | 1.6% | 19.7% |
| Standard Deviation (Population) | 1.6% | 19.5% |
Similar Demographics by Disability Age 5 to 17
Demographics Similar to Immigrants from Jordan by Disability Age 5 to 17
In terms of disability age 5 to 17, the demographic groups most similar to Immigrants from Jordan are Immigrants from Grenada (5.3%, a difference of 0.020%), Immigrants from Peru (5.3%, a difference of 0.070%), Luxembourger (5.3%, a difference of 0.14%), Mongolian (5.3%, a difference of 0.16%), and Immigrants from El Salvador (5.3%, a difference of 0.18%).
| Demographics | Rating | Rank | Disability Age 5 to 17 |
| Eastern Europeans | 99.4 /100 | #87 | Exceptional 5.2% |
| Immigrants | Croatia | 99.4 /100 | #88 | Exceptional 5.2% |
| Immigrants | Spain | 99.4 /100 | #89 | Exceptional 5.2% |
| Immigrants | Kuwait | 99.4 /100 | #90 | Exceptional 5.3% |
| Mongolians | 99.2 /100 | #91 | Exceptional 5.3% |
| Luxembourgers | 99.2 /100 | #92 | Exceptional 5.3% |
| Immigrants | Peru | 99.1 /100 | #93 | Exceptional 5.3% |
| Immigrants | Jordan | 99.1 /100 | #94 | Exceptional 5.3% |
| Immigrants | Grenada | 99.1 /100 | #95 | Exceptional 5.3% |
| Immigrants | El Salvador | 99.0 /100 | #96 | Exceptional 5.3% |
| Immigrants | Europe | 99.0 /100 | #97 | Exceptional 5.3% |
| Immigrants | Austria | 98.9 /100 | #98 | Exceptional 5.3% |
| Cambodians | 98.8 /100 | #99 | Exceptional 5.3% |
| Nepalese | 98.7 /100 | #100 | Exceptional 5.3% |
| Menominee | 98.7 /100 | #101 | Exceptional 5.3% |
Demographics Similar to Slavs by Disability Age 5 to 17
In terms of disability age 5 to 17, the demographic groups most similar to Slavs are Brazilian (5.9%, a difference of 0.060%), Hispanic or Latino (5.9%, a difference of 0.090%), Somali (5.9%, a difference of 0.13%), Hopi (5.9%, a difference of 0.18%), and Immigrants from Middle Africa (5.9%, a difference of 0.20%).
| Demographics | Rating | Rank | Disability Age 5 to 17 |
| Hondurans | 1.5 /100 | #252 | Tragic 5.9% |
| Scandinavians | 1.4 /100 | #253 | Tragic 5.9% |
| Barbadians | 1.3 /100 | #254 | Tragic 5.9% |
| Italians | 1.2 /100 | #255 | Tragic 5.9% |
| Hopi | 1.0 /100 | #256 | Tragic 5.9% |
| Hispanics or Latinos | 1.0 /100 | #257 | Tragic 5.9% |
| Brazilians | 0.9 /100 | #258 | Tragic 5.9% |
| Slavs | 0.9 /100 | #259 | Tragic 5.9% |
| Somalis | 0.8 /100 | #260 | Tragic 5.9% |
| Immigrants | Middle Africa | 0.7 /100 | #261 | Tragic 5.9% |
| Immigrants | Western Africa | 0.7 /100 | #262 | Tragic 5.9% |
| Czechoslovakians | 0.7 /100 | #263 | Tragic 5.9% |
| Canadians | 0.6 /100 | #264 | Tragic 6.0% |
| Panamanians | 0.6 /100 | #265 | Tragic 6.0% |
| Slovenes | 0.6 /100 | #266 | Tragic 6.0% |