Lithuanian vs Immigrants from Cuba 2nd Grade
COMPARE
Lithuanian
Immigrants from Cuba
2nd Grade
2nd Grade Comparison
Lithuanians
Immigrants from Cuba
98.5%
2ND GRADE
100.0/ 100
METRIC RATING
21st/ 347
METRIC RANK
97.0%
2ND GRADE
0.0/ 100
METRIC RATING
297th/ 347
METRIC RANK
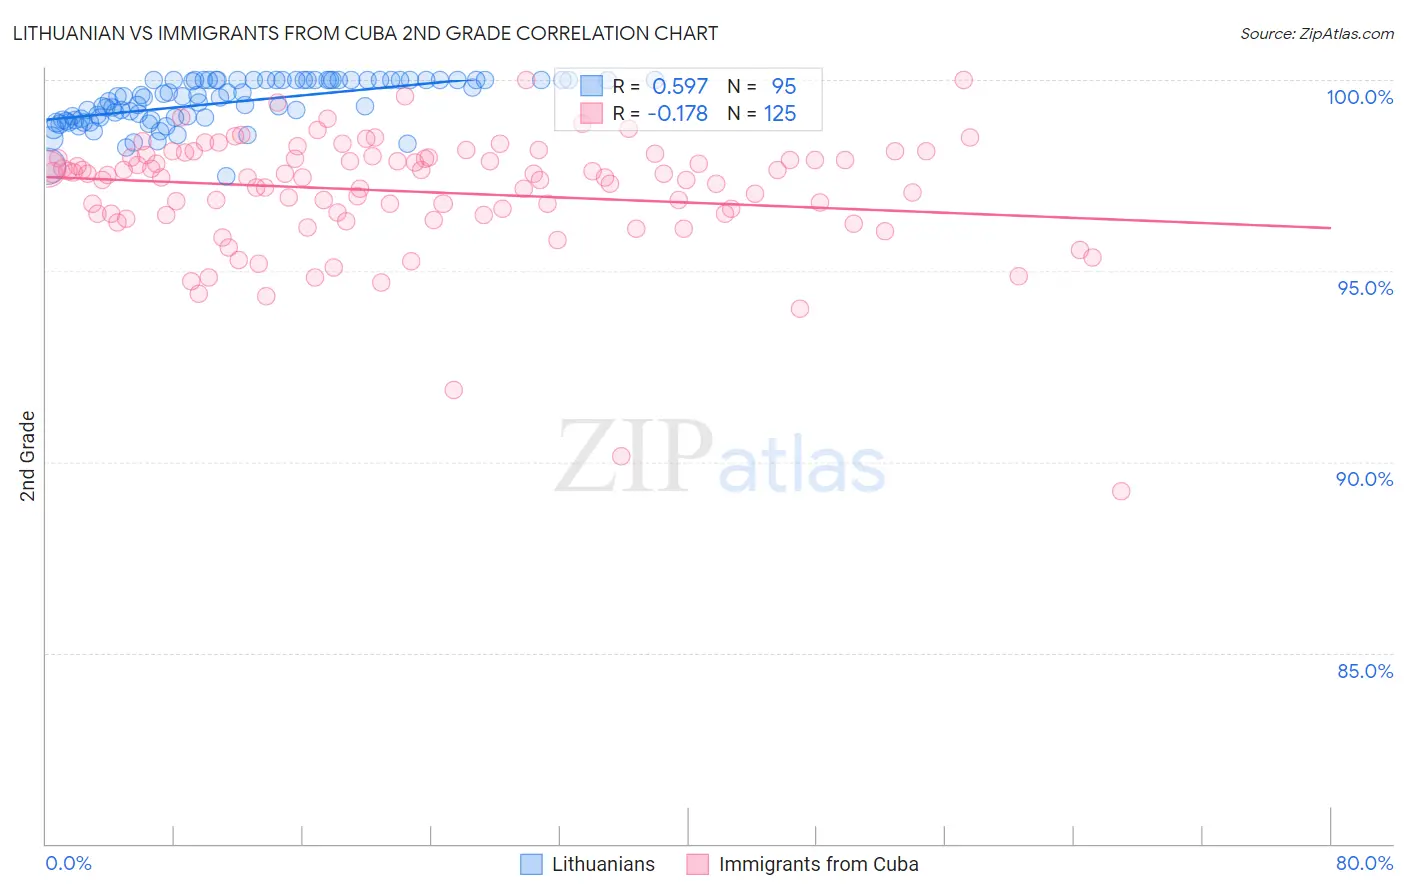
Lithuanian vs Immigrants from Cuba 2nd Grade Correlation Chart
The statistical analysis conducted on geographies consisting of 421,946,231 people shows a substantial positive correlation between the proportion of Lithuanians and percentage of population with at least 2nd grade education in the United States with a correlation coefficient (R) of 0.597 and weighted average of 98.5%. Similarly, the statistical analysis conducted on geographies consisting of 326,028,159 people shows a poor negative correlation between the proportion of Immigrants from Cuba and percentage of population with at least 2nd grade education in the United States with a correlation coefficient (R) of -0.178 and weighted average of 97.0%, a difference of 1.6%.
2nd Grade Correlation Summary
| Measurement | Lithuanian | Immigrants from Cuba |
| Minimum | 97.5% | 89.2% |
| Maximum | 100.0% | 100.0% |
| Range | 2.5% | 10.8% |
| Mean | 99.4% | 97.1% |
| Median | 99.5% | 97.5% |
| Interquartile 25% (IQ1) | 99.0% | 96.5% |
| Interquartile 75% (IQ3) | 100.0% | 98.0% |
| Interquartile Range (IQR) | 1.0% | 1.5% |
| Standard Deviation (Sample) | 0.59% | 1.6% |
| Standard Deviation (Population) | 0.59% | 1.6% |
Similar Demographics by 2nd Grade
Demographics Similar to Lithuanians by 2nd Grade
In terms of 2nd grade, the demographic groups most similar to Lithuanians are Finnish (98.5%, a difference of 0.0%), Sioux (98.5%, a difference of 0.0%), Polish (98.5%, a difference of 0.0%), Danish (98.5%, a difference of 0.0%), and Pennsylvania German (98.5%, a difference of 0.0%).
| Demographics | Rating | Rank | 2nd Grade |
| Swedes | 100.0 /100 | #14 | Exceptional 98.6% |
| Scottish | 100.0 /100 | #15 | Exceptional 98.6% |
| Dutch | 100.0 /100 | #16 | Exceptional 98.6% |
| Aleuts | 100.0 /100 | #17 | Exceptional 98.6% |
| Irish | 100.0 /100 | #18 | Exceptional 98.6% |
| Finns | 100.0 /100 | #19 | Exceptional 98.5% |
| Sioux | 100.0 /100 | #20 | Exceptional 98.5% |
| Lithuanians | 100.0 /100 | #21 | Exceptional 98.5% |
| Poles | 100.0 /100 | #22 | Exceptional 98.5% |
| Danes | 100.0 /100 | #23 | Exceptional 98.5% |
| Pennsylvania Germans | 100.0 /100 | #24 | Exceptional 98.5% |
| Scotch-Irish | 100.0 /100 | #25 | Exceptional 98.5% |
| Welsh | 100.0 /100 | #26 | Exceptional 98.5% |
| Croatians | 100.0 /100 | #27 | Exceptional 98.5% |
| Arapaho | 100.0 /100 | #28 | Exceptional 98.5% |
Demographics Similar to Immigrants from Cuba by 2nd Grade
In terms of 2nd grade, the demographic groups most similar to Immigrants from Cuba are Immigrants from Dominica (97.0%, a difference of 0.0%), Haitian (97.0%, a difference of 0.0%), Immigrants from South Eastern Asia (97.0%, a difference of 0.020%), Central American Indian (97.0%, a difference of 0.040%), and Immigrants (97.1%, a difference of 0.060%).
| Demographics | Rating | Rank | 2nd Grade |
| Immigrants | St. Vincent and the Grenadines | 0.0 /100 | #290 | Tragic 97.2% |
| Immigrants | Afghanistan | 0.0 /100 | #291 | Tragic 97.2% |
| Immigrants | Eritrea | 0.0 /100 | #292 | Tragic 97.2% |
| British West Indians | 0.0 /100 | #293 | Tragic 97.2% |
| Malaysians | 0.0 /100 | #294 | Tragic 97.1% |
| Immigrants | Grenada | 0.0 /100 | #295 | Tragic 97.1% |
| Immigrants | Immigrants | 0.0 /100 | #296 | Tragic 97.1% |
| Immigrants | Cuba | 0.0 /100 | #297 | Tragic 97.0% |
| Immigrants | Dominica | 0.0 /100 | #298 | Tragic 97.0% |
| Haitians | 0.0 /100 | #299 | Tragic 97.0% |
| Immigrants | South Eastern Asia | 0.0 /100 | #300 | Tragic 97.0% |
| Central American Indians | 0.0 /100 | #301 | Tragic 97.0% |
| Somalis | 0.0 /100 | #302 | Tragic 97.0% |
| Ecuadorians | 0.0 /100 | #303 | Tragic 96.9% |
| Immigrants | Caribbean | 0.0 /100 | #304 | Tragic 96.9% |