Kenyan vs Immigrants from Iran Self-Care Disability
COMPARE
Kenyan
Immigrants from Iran
Self-Care Disability
Self-Care Disability Comparison
Kenyans
Immigrants from Iran
2.3%
SELF-CARE DISABILITY
99.7/ 100
METRIC RATING
51st/ 347
METRIC RANK
2.7%
SELF-CARE DISABILITY
0.2/ 100
METRIC RATING
264th/ 347
METRIC RANK
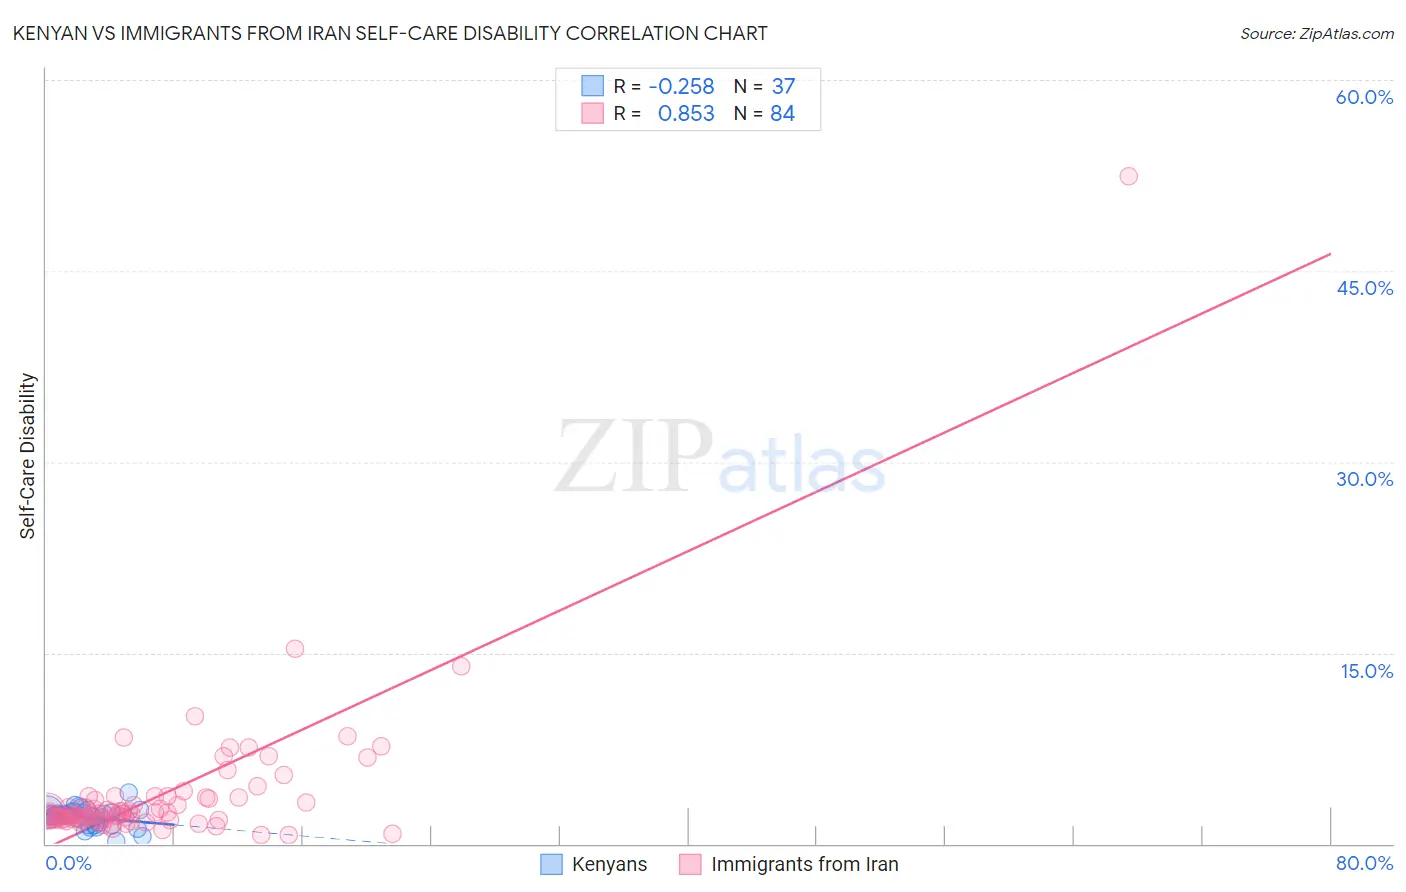
Kenyan vs Immigrants from Iran Self-Care Disability Correlation Chart
The statistical analysis conducted on geographies consisting of 168,082,411 people shows a weak negative correlation between the proportion of Kenyans and percentage of population with self-care disability in the United States with a correlation coefficient (R) of -0.258 and weighted average of 2.3%. Similarly, the statistical analysis conducted on geographies consisting of 279,736,483 people shows a very strong positive correlation between the proportion of Immigrants from Iran and percentage of population with self-care disability in the United States with a correlation coefficient (R) of 0.853 and weighted average of 2.7%, a difference of 15.3%.
Self-Care Disability Correlation Summary
| Measurement | Kenyan | Immigrants from Iran |
| Minimum | 0.23% | 0.72% |
| Maximum | 4.1% | 52.5% |
| Range | 3.8% | 51.8% |
| Mean | 2.1% | 3.9% |
| Median | 2.2% | 2.3% |
| Interquartile 25% (IQ1) | 1.6% | 1.9% |
| Interquartile 75% (IQ3) | 2.5% | 3.6% |
| Interquartile Range (IQR) | 0.87% | 1.7% |
| Standard Deviation (Sample) | 0.71% | 6.0% |
| Standard Deviation (Population) | 0.70% | 5.9% |
Similar Demographics by Self-Care Disability
Demographics Similar to Kenyans by Self-Care Disability
In terms of self-care disability, the demographic groups most similar to Kenyans are Immigrants from Serbia (2.3%, a difference of 0.020%), Australian (2.3%, a difference of 0.060%), Argentinean (2.3%, a difference of 0.10%), Immigrants from Brazil (2.3%, a difference of 0.15%), and Latvian (2.3%, a difference of 0.17%).
| Demographics | Rating | Rank | Self-Care Disability |
| Immigrants | South Africa | 99.8 /100 | #44 | Exceptional 2.3% |
| Norwegians | 99.8 /100 | #45 | Exceptional 2.3% |
| Czechs | 99.8 /100 | #46 | Exceptional 2.3% |
| Jordanians | 99.7 /100 | #47 | Exceptional 2.3% |
| Immigrants | Malaysia | 99.7 /100 | #48 | Exceptional 2.3% |
| Latvians | 99.7 /100 | #49 | Exceptional 2.3% |
| Immigrants | Brazil | 99.7 /100 | #50 | Exceptional 2.3% |
| Kenyans | 99.7 /100 | #51 | Exceptional 2.3% |
| Immigrants | Serbia | 99.6 /100 | #52 | Exceptional 2.3% |
| Australians | 99.6 /100 | #53 | Exceptional 2.3% |
| Argentineans | 99.6 /100 | #54 | Exceptional 2.3% |
| Immigrants | France | 99.6 /100 | #55 | Exceptional 2.3% |
| Immigrants | Eastern Asia | 99.6 /100 | #56 | Exceptional 2.3% |
| Immigrants | Belgium | 99.6 /100 | #57 | Exceptional 2.3% |
| Immigrants | Cameroon | 99.6 /100 | #58 | Exceptional 2.3% |
Demographics Similar to Immigrants from Iran by Self-Care Disability
In terms of self-care disability, the demographic groups most similar to Immigrants from Iran are Immigrants from Latin America (2.7%, a difference of 0.060%), Shoshone (2.7%, a difference of 0.13%), Immigrants from Nicaragua (2.7%, a difference of 0.16%), Immigrants from Cambodia (2.7%, a difference of 0.21%), and Arapaho (2.6%, a difference of 0.27%).
| Demographics | Rating | Rank | Self-Care Disability |
| Potawatomi | 0.3 /100 | #257 | Tragic 2.6% |
| Immigrants | Nonimmigrants | 0.3 /100 | #258 | Tragic 2.6% |
| Immigrants | Belarus | 0.2 /100 | #259 | Tragic 2.6% |
| Chippewa | 0.2 /100 | #260 | Tragic 2.6% |
| Arapaho | 0.2 /100 | #261 | Tragic 2.6% |
| Shoshone | 0.2 /100 | #262 | Tragic 2.7% |
| Immigrants | Latin America | 0.2 /100 | #263 | Tragic 2.7% |
| Immigrants | Iran | 0.2 /100 | #264 | Tragic 2.7% |
| Immigrants | Nicaragua | 0.2 /100 | #265 | Tragic 2.7% |
| Immigrants | Cambodia | 0.1 /100 | #266 | Tragic 2.7% |
| Yaqui | 0.1 /100 | #267 | Tragic 2.7% |
| Immigrants | Mexico | 0.1 /100 | #268 | Tragic 2.7% |
| U.S. Virgin Islanders | 0.1 /100 | #269 | Tragic 2.7% |
| Immigrants | Micronesia | 0.1 /100 | #270 | Tragic 2.7% |
| Trinidadians and Tobagonians | 0.1 /100 | #271 | Tragic 2.7% |