Kenyan vs Immigrants from Iran Associate's Degree
COMPARE
Kenyan
Immigrants from Iran
Associate's Degree
Associate's Degree Comparison
Kenyans
Immigrants from Iran
47.1%
ASSOCIATE'S DEGREE
70.6/ 100
METRIC RATING
155th/ 347
METRIC RANK
57.7%
ASSOCIATE'S DEGREE
100.0/ 100
METRIC RATING
7th/ 347
METRIC RANK
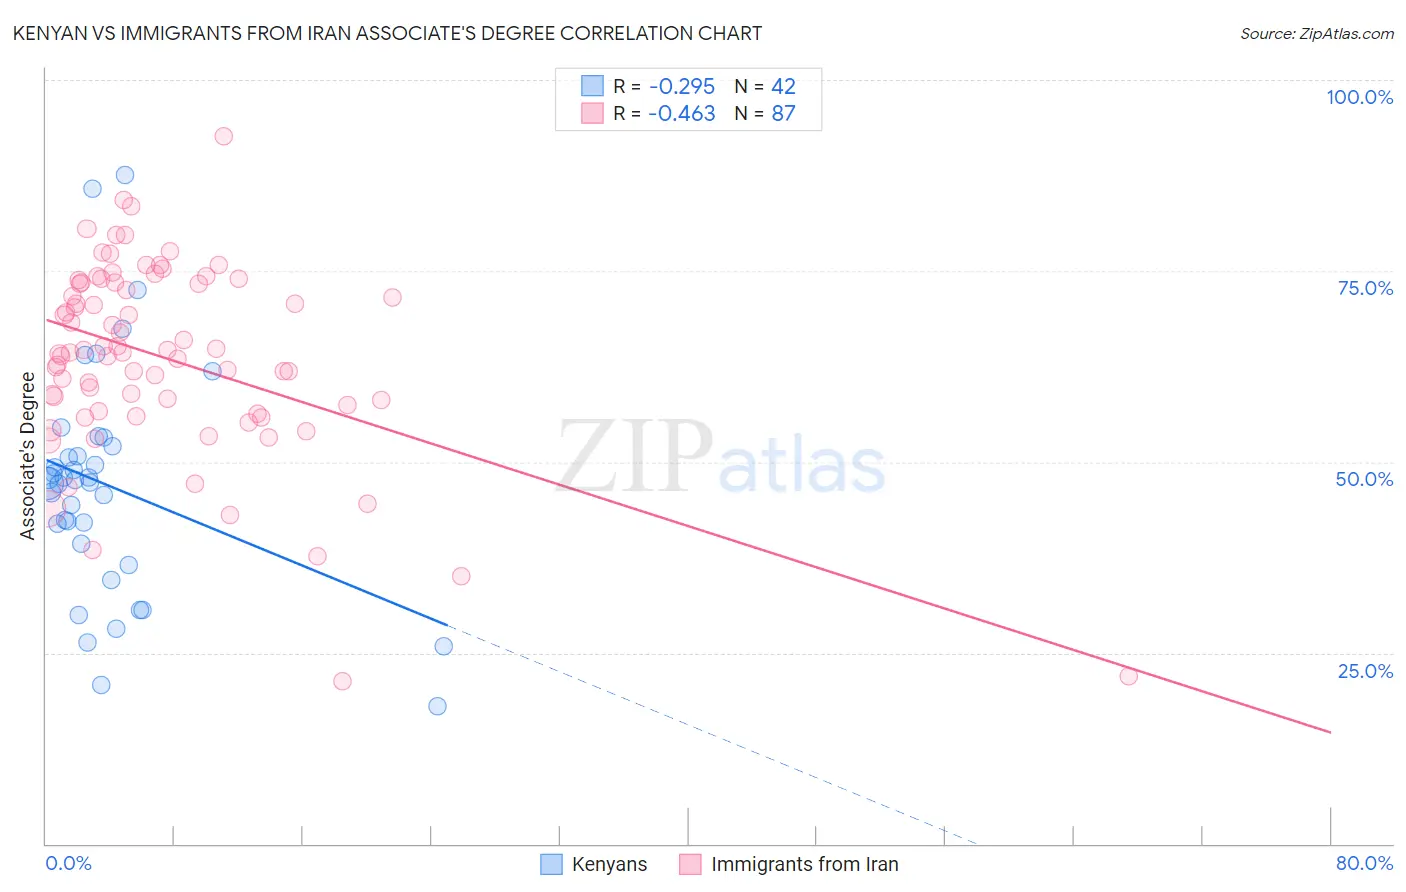
Kenyan vs Immigrants from Iran Associate's Degree Correlation Chart
The statistical analysis conducted on geographies consisting of 168,244,481 people shows a weak negative correlation between the proportion of Kenyans and percentage of population with at least associate's degree education in the United States with a correlation coefficient (R) of -0.295 and weighted average of 47.1%. Similarly, the statistical analysis conducted on geographies consisting of 279,901,674 people shows a moderate negative correlation between the proportion of Immigrants from Iran and percentage of population with at least associate's degree education in the United States with a correlation coefficient (R) of -0.463 and weighted average of 57.7%, a difference of 22.4%.
Associate's Degree Correlation Summary
| Measurement | Kenyan | Immigrants from Iran |
| Minimum | 18.0% | 21.3% |
| Maximum | 87.6% | 92.6% |
| Range | 69.6% | 71.3% |
| Mean | 47.0% | 63.6% |
| Median | 47.5% | 64.3% |
| Interquartile 25% (IQ1) | 39.3% | 56.7% |
| Interquartile 75% (IQ3) | 52.1% | 73.4% |
| Interquartile Range (IQR) | 12.8% | 16.8% |
| Standard Deviation (Sample) | 15.0% | 12.7% |
| Standard Deviation (Population) | 14.8% | 12.7% |
Similar Demographics by Associate's Degree
Demographics Similar to Kenyans by Associate's Degree
In terms of associate's degree, the demographic groups most similar to Kenyans are South American (47.1%, a difference of 0.010%), Sudanese (47.1%, a difference of 0.030%), Immigrants from Germany (47.1%, a difference of 0.080%), Immigrants from Kenya (47.2%, a difference of 0.13%), and Immigrants from Poland (47.1%, a difference of 0.13%).
| Demographics | Rating | Rank | Associate's Degree |
| South American Indians | 76.7 /100 | #148 | Good 47.4% |
| Immigrants | Armenia | 76.6 /100 | #149 | Good 47.4% |
| Iraqis | 76.2 /100 | #150 | Good 47.4% |
| Immigrants | North Macedonia | 76.0 /100 | #151 | Good 47.4% |
| Immigrants | Afghanistan | 74.3 /100 | #152 | Good 47.3% |
| Czechs | 72.2 /100 | #153 | Good 47.2% |
| Immigrants | Kenya | 72.1 /100 | #154 | Good 47.2% |
| Kenyans | 70.6 /100 | #155 | Good 47.1% |
| South Americans | 70.5 /100 | #156 | Good 47.1% |
| Sudanese | 70.3 /100 | #157 | Good 47.1% |
| Immigrants | Germany | 69.7 /100 | #158 | Good 47.1% |
| Immigrants | Poland | 69.2 /100 | #159 | Good 47.1% |
| Scottish | 65.4 /100 | #160 | Good 46.9% |
| Scandinavians | 65.2 /100 | #161 | Good 46.9% |
| Immigrants | Africa | 63.2 /100 | #162 | Good 46.8% |
Demographics Similar to Immigrants from Iran by Associate's Degree
In terms of associate's degree, the demographic groups most similar to Immigrants from Iran are Okinawan (57.7%, a difference of 0.060%), Thai (57.4%, a difference of 0.40%), Iranian (58.2%, a difference of 0.89%), Immigrants from Taiwan (58.4%, a difference of 1.3%), and Immigrants from Israel (56.8%, a difference of 1.5%).
| Demographics | Rating | Rank | Associate's Degree |
| Filipinos | 100.0 /100 | #1 | Exceptional 59.8% |
| Immigrants | Singapore | 100.0 /100 | #2 | Exceptional 58.9% |
| Immigrants | India | 100.0 /100 | #3 | Exceptional 58.5% |
| Immigrants | Taiwan | 100.0 /100 | #4 | Exceptional 58.4% |
| Iranians | 100.0 /100 | #5 | Exceptional 58.2% |
| Okinawans | 100.0 /100 | #6 | Exceptional 57.7% |
| Immigrants | Iran | 100.0 /100 | #7 | Exceptional 57.7% |
| Thais | 100.0 /100 | #8 | Exceptional 57.4% |
| Immigrants | Israel | 100.0 /100 | #9 | Exceptional 56.8% |
| Cypriots | 100.0 /100 | #10 | Exceptional 56.4% |
| Immigrants | Australia | 100.0 /100 | #11 | Exceptional 55.8% |
| Immigrants | South Central Asia | 100.0 /100 | #12 | Exceptional 55.7% |
| Immigrants | China | 100.0 /100 | #13 | Exceptional 55.5% |
| Immigrants | Hong Kong | 100.0 /100 | #14 | Exceptional 55.4% |
| Immigrants | Eastern Asia | 100.0 /100 | #15 | Exceptional 55.4% |