Portuguese vs Immigrants from Iran Self-Care Disability
COMPARE
Portuguese
Immigrants from Iran
Self-Care Disability
Self-Care Disability Comparison
Portuguese
Immigrants from Iran
2.6%
SELF-CARE DISABILITY
0.4/ 100
METRIC RATING
250th/ 347
METRIC RANK
2.7%
SELF-CARE DISABILITY
0.2/ 100
METRIC RATING
264th/ 347
METRIC RANK
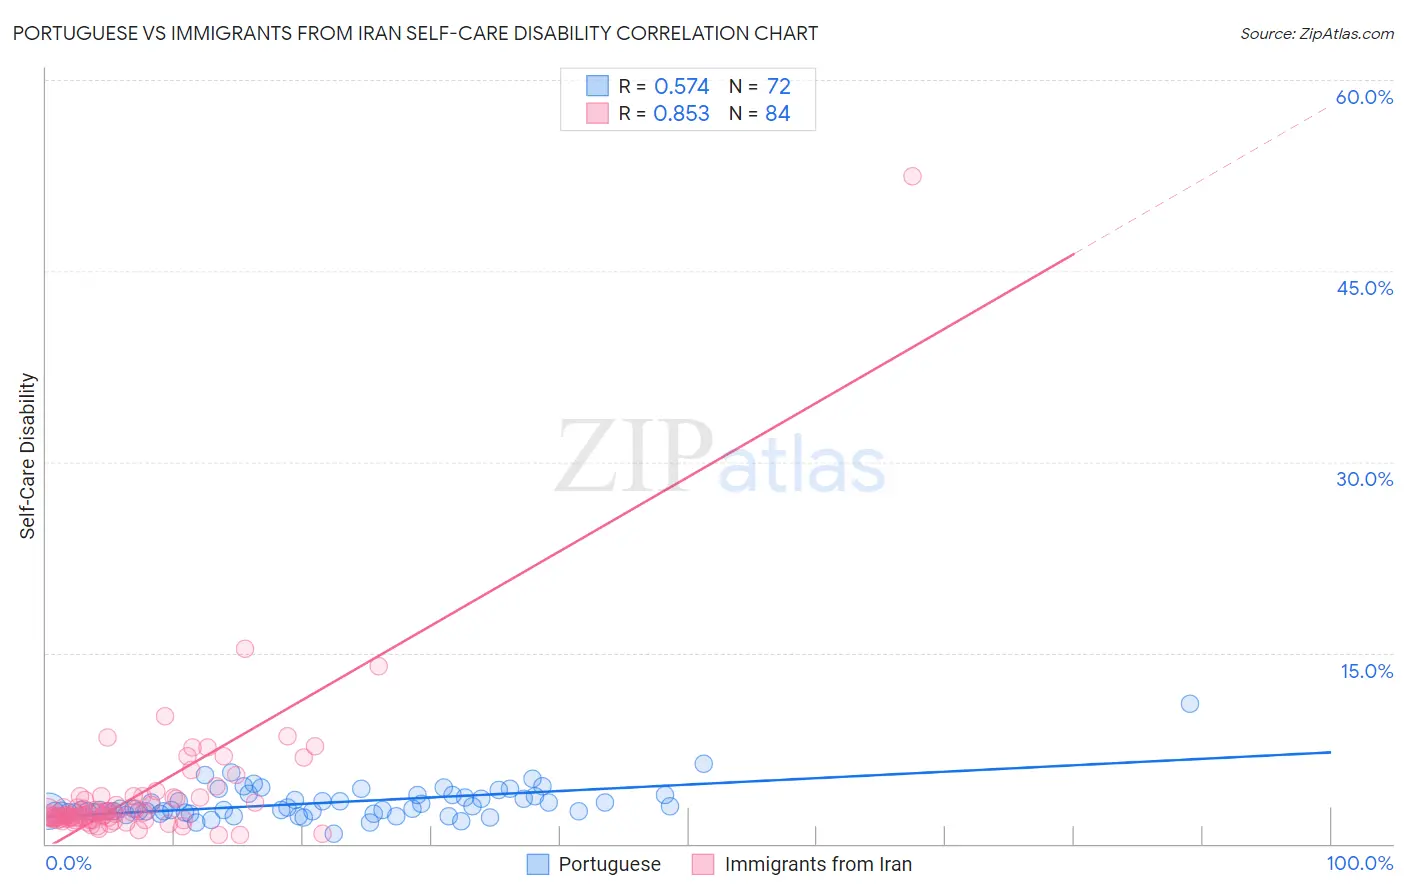
Portuguese vs Immigrants from Iran Self-Care Disability Correlation Chart
The statistical analysis conducted on geographies consisting of 449,515,942 people shows a substantial positive correlation between the proportion of Portuguese and percentage of population with self-care disability in the United States with a correlation coefficient (R) of 0.574 and weighted average of 2.6%. Similarly, the statistical analysis conducted on geographies consisting of 279,736,483 people shows a very strong positive correlation between the proportion of Immigrants from Iran and percentage of population with self-care disability in the United States with a correlation coefficient (R) of 0.853 and weighted average of 2.7%, a difference of 0.98%.
Self-Care Disability Correlation Summary
| Measurement | Portuguese | Immigrants from Iran |
| Minimum | 0.74% | 0.72% |
| Maximum | 11.0% | 52.5% |
| Range | 10.2% | 51.8% |
| Mean | 3.2% | 3.9% |
| Median | 2.7% | 2.3% |
| Interquartile 25% (IQ1) | 2.5% | 1.9% |
| Interquartile 75% (IQ3) | 3.7% | 3.6% |
| Interquartile Range (IQR) | 1.3% | 1.7% |
| Standard Deviation (Sample) | 1.4% | 6.0% |
| Standard Deviation (Population) | 1.4% | 5.9% |
Demographics Similar to Portuguese and Immigrants from Iran by Self-Care Disability
In terms of self-care disability, the demographic groups most similar to Portuguese are Mexican American Indian (2.6%, a difference of 0.080%), Immigrants from Liberia (2.6%, a difference of 0.080%), Immigrants from Bangladesh (2.6%, a difference of 0.15%), Immigrants from Haiti (2.6%, a difference of 0.23%), and Haitian (2.6%, a difference of 0.25%). Similarly, the demographic groups most similar to Immigrants from Iran are Immigrants from Latin America (2.7%, a difference of 0.060%), Shoshone (2.7%, a difference of 0.13%), Immigrants from Nicaragua (2.7%, a difference of 0.16%), Immigrants from Cambodia (2.7%, a difference of 0.21%), and Arapaho (2.6%, a difference of 0.27%).
| Demographics | Rating | Rank | Self-Care Disability |
| Immigrants | Albania | 0.6 /100 | #247 | Tragic 2.6% |
| Nicaraguans | 0.6 /100 | #248 | Tragic 2.6% |
| Mexican American Indians | 0.5 /100 | #249 | Tragic 2.6% |
| Portuguese | 0.4 /100 | #250 | Tragic 2.6% |
| Immigrants | Liberia | 0.4 /100 | #251 | Tragic 2.6% |
| Immigrants | Bangladesh | 0.4 /100 | #252 | Tragic 2.6% |
| Immigrants | Haiti | 0.3 /100 | #253 | Tragic 2.6% |
| Haitians | 0.3 /100 | #254 | Tragic 2.6% |
| Tsimshian | 0.3 /100 | #255 | Tragic 2.6% |
| Immigrants | Central America | 0.3 /100 | #256 | Tragic 2.6% |
| Potawatomi | 0.3 /100 | #257 | Tragic 2.6% |
| Immigrants | Nonimmigrants | 0.3 /100 | #258 | Tragic 2.6% |
| Immigrants | Belarus | 0.2 /100 | #259 | Tragic 2.6% |
| Chippewa | 0.2 /100 | #260 | Tragic 2.6% |
| Arapaho | 0.2 /100 | #261 | Tragic 2.6% |
| Shoshone | 0.2 /100 | #262 | Tragic 2.7% |
| Immigrants | Latin America | 0.2 /100 | #263 | Tragic 2.7% |
| Immigrants | Iran | 0.2 /100 | #264 | Tragic 2.7% |
| Immigrants | Nicaragua | 0.2 /100 | #265 | Tragic 2.7% |
| Immigrants | Cambodia | 0.1 /100 | #266 | Tragic 2.7% |
| Yaqui | 0.1 /100 | #267 | Tragic 2.7% |