Native/Alaskan vs Immigrants from Iran Self-Care Disability
COMPARE
Native/Alaskan
Immigrants from Iran
Self-Care Disability
Self-Care Disability Comparison
Natives/Alaskans
Immigrants from Iran
2.8%
SELF-CARE DISABILITY
0.0/ 100
METRIC RATING
307th/ 347
METRIC RANK
2.7%
SELF-CARE DISABILITY
0.2/ 100
METRIC RATING
264th/ 347
METRIC RANK
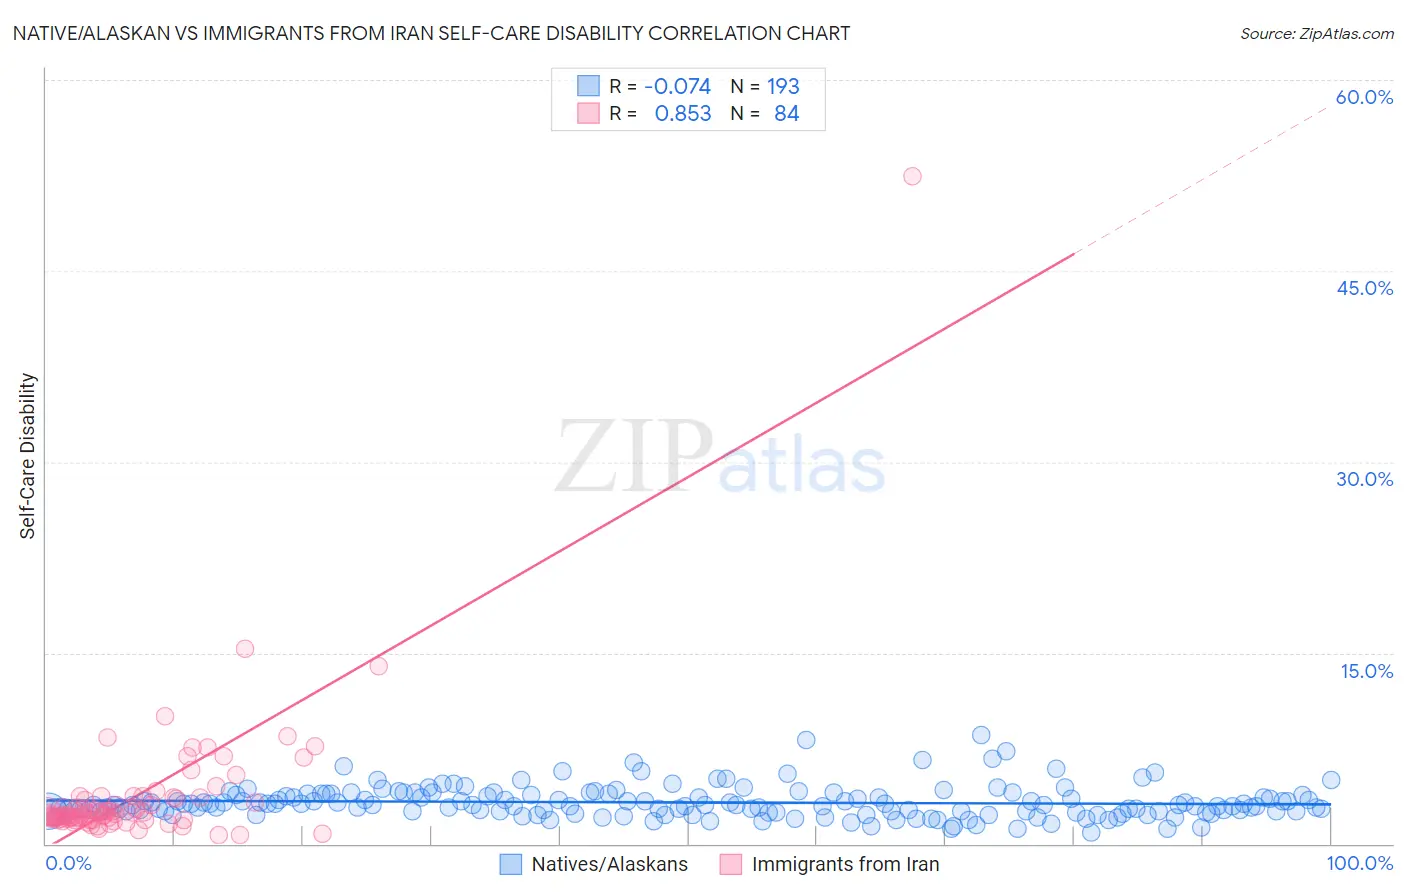
Native/Alaskan vs Immigrants from Iran Self-Care Disability Correlation Chart
The statistical analysis conducted on geographies consisting of 511,798,429 people shows a slight negative correlation between the proportion of Natives/Alaskans and percentage of population with self-care disability in the United States with a correlation coefficient (R) of -0.074 and weighted average of 2.8%. Similarly, the statistical analysis conducted on geographies consisting of 279,736,483 people shows a very strong positive correlation between the proportion of Immigrants from Iran and percentage of population with self-care disability in the United States with a correlation coefficient (R) of 0.853 and weighted average of 2.7%, a difference of 5.8%.
Self-Care Disability Correlation Summary
| Measurement | Native/Alaskan | Immigrants from Iran |
| Minimum | 0.90% | 0.72% |
| Maximum | 8.5% | 52.5% |
| Range | 7.7% | 51.8% |
| Mean | 3.2% | 3.9% |
| Median | 3.0% | 2.3% |
| Interquartile 25% (IQ1) | 2.5% | 1.9% |
| Interquartile 75% (IQ3) | 3.9% | 3.6% |
| Interquartile Range (IQR) | 1.3% | 1.7% |
| Standard Deviation (Sample) | 1.2% | 6.0% |
| Standard Deviation (Population) | 1.2% | 5.9% |
Similar Demographics by Self-Care Disability
Demographics Similar to Natives/Alaskans by Self-Care Disability
In terms of self-care disability, the demographic groups most similar to Natives/Alaskans are Aleut (2.8%, a difference of 0.070%), Immigrants from Grenada (2.8%, a difference of 0.30%), Bangladeshi (2.8%, a difference of 0.45%), Immigrants from West Indies (2.8%, a difference of 0.47%), and Cree (2.8%, a difference of 0.52%).
| Demographics | Rating | Rank | Self-Care Disability |
| Immigrants | Fiji | 0.0 /100 | #300 | Tragic 2.8% |
| Pima | 0.0 /100 | #301 | Tragic 2.8% |
| Immigrants | St. Vincent and the Grenadines | 0.0 /100 | #302 | Tragic 2.8% |
| Immigrants | Belize | 0.0 /100 | #303 | Tragic 2.8% |
| Cree | 0.0 /100 | #304 | Tragic 2.8% |
| Immigrants | West Indies | 0.0 /100 | #305 | Tragic 2.8% |
| Aleuts | 0.0 /100 | #306 | Tragic 2.8% |
| Natives/Alaskans | 0.0 /100 | #307 | Tragic 2.8% |
| Immigrants | Grenada | 0.0 /100 | #308 | Tragic 2.8% |
| Bangladeshis | 0.0 /100 | #309 | Tragic 2.8% |
| British West Indians | 0.0 /100 | #310 | Tragic 2.8% |
| Puget Sound Salish | 0.0 /100 | #311 | Tragic 2.8% |
| Immigrants | Caribbean | 0.0 /100 | #312 | Tragic 2.8% |
| Spanish Americans | 0.0 /100 | #313 | Tragic 2.8% |
| Creek | 0.0 /100 | #314 | Tragic 2.8% |
Demographics Similar to Immigrants from Iran by Self-Care Disability
In terms of self-care disability, the demographic groups most similar to Immigrants from Iran are Immigrants from Latin America (2.7%, a difference of 0.060%), Shoshone (2.7%, a difference of 0.13%), Immigrants from Nicaragua (2.7%, a difference of 0.16%), Immigrants from Cambodia (2.7%, a difference of 0.21%), and Arapaho (2.6%, a difference of 0.27%).
| Demographics | Rating | Rank | Self-Care Disability |
| Potawatomi | 0.3 /100 | #257 | Tragic 2.6% |
| Immigrants | Nonimmigrants | 0.3 /100 | #258 | Tragic 2.6% |
| Immigrants | Belarus | 0.2 /100 | #259 | Tragic 2.6% |
| Chippewa | 0.2 /100 | #260 | Tragic 2.6% |
| Arapaho | 0.2 /100 | #261 | Tragic 2.6% |
| Shoshone | 0.2 /100 | #262 | Tragic 2.7% |
| Immigrants | Latin America | 0.2 /100 | #263 | Tragic 2.7% |
| Immigrants | Iran | 0.2 /100 | #264 | Tragic 2.7% |
| Immigrants | Nicaragua | 0.2 /100 | #265 | Tragic 2.7% |
| Immigrants | Cambodia | 0.1 /100 | #266 | Tragic 2.7% |
| Yaqui | 0.1 /100 | #267 | Tragic 2.7% |
| Immigrants | Mexico | 0.1 /100 | #268 | Tragic 2.7% |
| U.S. Virgin Islanders | 0.1 /100 | #269 | Tragic 2.7% |
| Immigrants | Micronesia | 0.1 /100 | #270 | Tragic 2.7% |
| Trinidadians and Tobagonians | 0.1 /100 | #271 | Tragic 2.7% |