Kenyan vs Indonesian Self-Care Disability
COMPARE
Kenyan
Indonesian
Self-Care Disability
Self-Care Disability Comparison
Kenyans
Indonesians
2.3%
SELF-CARE DISABILITY
99.7/ 100
METRIC RATING
51st/ 347
METRIC RANK
2.5%
SELF-CARE DISABILITY
41.2/ 100
METRIC RATING
180th/ 347
METRIC RANK
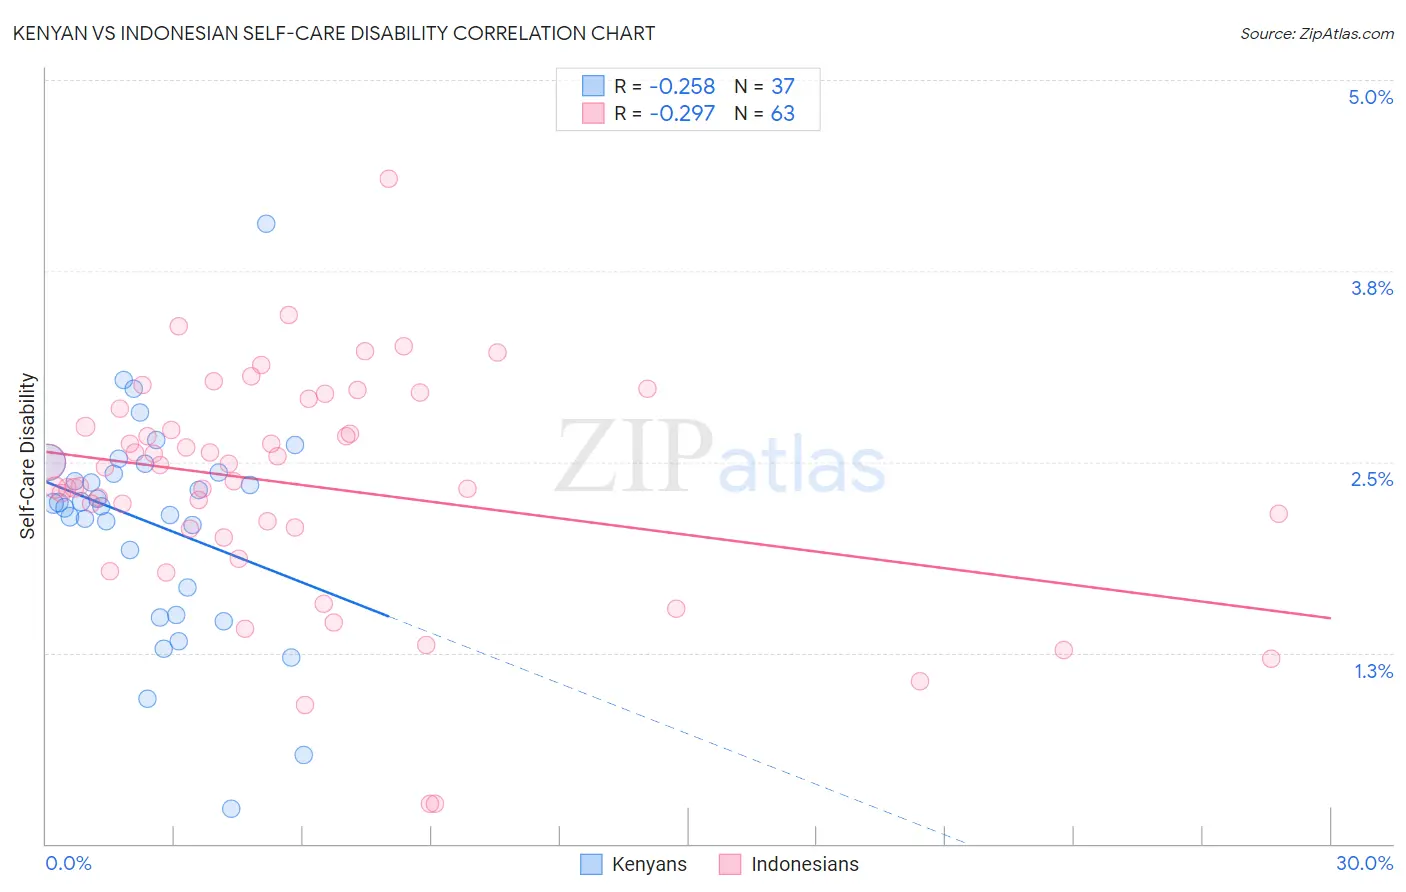
Kenyan vs Indonesian Self-Care Disability Correlation Chart
The statistical analysis conducted on geographies consisting of 168,082,411 people shows a weak negative correlation between the proportion of Kenyans and percentage of population with self-care disability in the United States with a correlation coefficient (R) of -0.258 and weighted average of 2.3%. Similarly, the statistical analysis conducted on geographies consisting of 162,620,981 people shows a weak negative correlation between the proportion of Indonesians and percentage of population with self-care disability in the United States with a correlation coefficient (R) of -0.297 and weighted average of 2.5%, a difference of 7.7%.
Self-Care Disability Correlation Summary
| Measurement | Kenyan | Indonesian |
| Minimum | 0.23% | 0.26% |
| Maximum | 4.1% | 4.4% |
| Range | 3.8% | 4.1% |
| Mean | 2.1% | 2.3% |
| Median | 2.2% | 2.5% |
| Interquartile 25% (IQ1) | 1.6% | 2.1% |
| Interquartile 75% (IQ3) | 2.5% | 2.8% |
| Interquartile Range (IQR) | 0.87% | 0.79% |
| Standard Deviation (Sample) | 0.71% | 0.74% |
| Standard Deviation (Population) | 0.70% | 0.74% |
Similar Demographics by Self-Care Disability
Demographics Similar to Kenyans by Self-Care Disability
In terms of self-care disability, the demographic groups most similar to Kenyans are Immigrants from Serbia (2.3%, a difference of 0.020%), Australian (2.3%, a difference of 0.060%), Argentinean (2.3%, a difference of 0.10%), Immigrants from Brazil (2.3%, a difference of 0.15%), and Latvian (2.3%, a difference of 0.17%).
| Demographics | Rating | Rank | Self-Care Disability |
| Immigrants | South Africa | 99.8 /100 | #44 | Exceptional 2.3% |
| Norwegians | 99.8 /100 | #45 | Exceptional 2.3% |
| Czechs | 99.8 /100 | #46 | Exceptional 2.3% |
| Jordanians | 99.7 /100 | #47 | Exceptional 2.3% |
| Immigrants | Malaysia | 99.7 /100 | #48 | Exceptional 2.3% |
| Latvians | 99.7 /100 | #49 | Exceptional 2.3% |
| Immigrants | Brazil | 99.7 /100 | #50 | Exceptional 2.3% |
| Kenyans | 99.7 /100 | #51 | Exceptional 2.3% |
| Immigrants | Serbia | 99.6 /100 | #52 | Exceptional 2.3% |
| Australians | 99.6 /100 | #53 | Exceptional 2.3% |
| Argentineans | 99.6 /100 | #54 | Exceptional 2.3% |
| Immigrants | France | 99.6 /100 | #55 | Exceptional 2.3% |
| Immigrants | Eastern Asia | 99.6 /100 | #56 | Exceptional 2.3% |
| Immigrants | Belgium | 99.6 /100 | #57 | Exceptional 2.3% |
| Immigrants | Cameroon | 99.6 /100 | #58 | Exceptional 2.3% |
Demographics Similar to Indonesians by Self-Care Disability
In terms of self-care disability, the demographic groups most similar to Indonesians are Ghanaian (2.5%, a difference of 0.040%), Maltese (2.5%, a difference of 0.19%), Hungarian (2.5%, a difference of 0.21%), English (2.5%, a difference of 0.24%), and Salvadoran (2.5%, a difference of 0.24%).
| Demographics | Rating | Rank | Self-Care Disability |
| Immigrants | Burma/Myanmar | 52.8 /100 | #173 | Average 2.5% |
| Welsh | 50.0 /100 | #174 | Average 2.5% |
| Immigrants | Bosnia and Herzegovina | 49.6 /100 | #175 | Average 2.5% |
| Immigrants | Afghanistan | 47.6 /100 | #176 | Average 2.5% |
| Immigrants | Kazakhstan | 46.7 /100 | #177 | Average 2.5% |
| English | 46.2 /100 | #178 | Average 2.5% |
| Hungarians | 45.5 /100 | #179 | Average 2.5% |
| Indonesians | 41.2 /100 | #180 | Average 2.5% |
| Ghanaians | 40.4 /100 | #181 | Average 2.5% |
| Maltese | 37.5 /100 | #182 | Fair 2.5% |
| Salvadorans | 36.4 /100 | #183 | Fair 2.5% |
| Yugoslavians | 36.1 /100 | #184 | Fair 2.5% |
| Slavs | 34.3 /100 | #185 | Fair 2.5% |
| Immigrants | El Salvador | 33.0 /100 | #186 | Fair 2.5% |
| Irish | 28.7 /100 | #187 | Fair 2.5% |