Kenyan vs Immigrants from Iran Child Poverty Under the Age of 16
COMPARE
Kenyan
Immigrants from Iran
Child Poverty Under the Age of 16
Child Poverty Under the Age of 16 Comparison
Kenyans
Immigrants from Iran
16.5%
CHILD POVERTY UNDER THE AGE OF 16
34.1/ 100
METRIC RATING
186th/ 347
METRIC RANK
12.4%
CHILD POVERTY UNDER THE AGE OF 16
100.0/ 100
METRIC RATING
9th/ 347
METRIC RANK
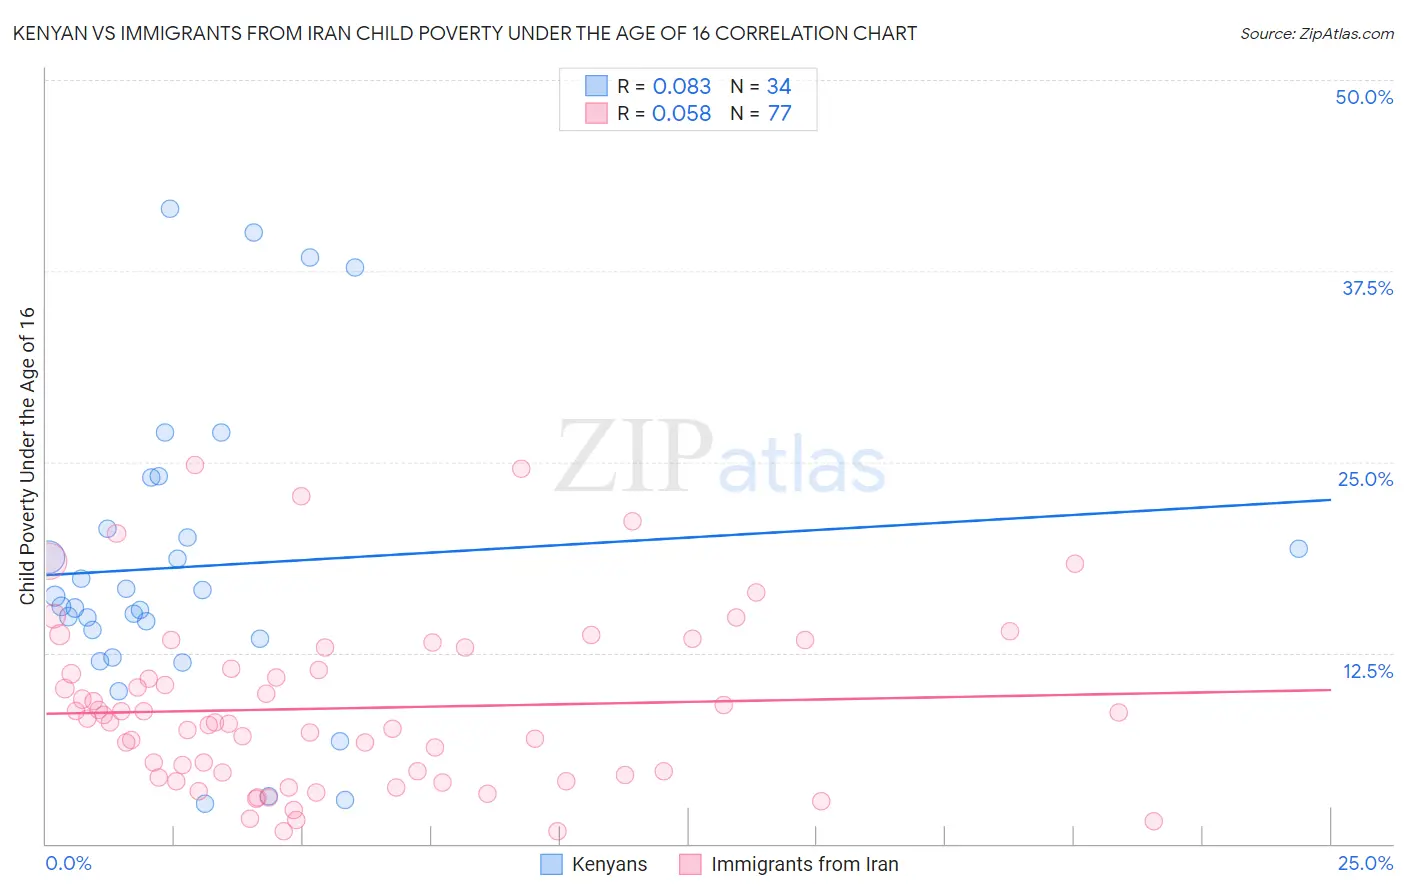
Kenyan vs Immigrants from Iran Child Poverty Under the Age of 16 Correlation Chart
The statistical analysis conducted on geographies consisting of 167,780,048 people shows a slight positive correlation between the proportion of Kenyans and poverty level among children under the age of 16 in the United States with a correlation coefficient (R) of 0.083 and weighted average of 16.5%. Similarly, the statistical analysis conducted on geographies consisting of 277,819,095 people shows a slight positive correlation between the proportion of Immigrants from Iran and poverty level among children under the age of 16 in the United States with a correlation coefficient (R) of 0.058 and weighted average of 12.4%, a difference of 33.5%.
Child Poverty Under the Age of 16 Correlation Summary
| Measurement | Kenyan | Immigrants from Iran |
| Minimum | 2.6% | 0.81% |
| Maximum | 41.6% | 24.8% |
| Range | 38.9% | 24.0% |
| Mean | 18.2% | 8.9% |
| Median | 15.9% | 8.0% |
| Interquartile 25% (IQ1) | 13.4% | 4.4% |
| Interquartile 75% (IQ3) | 20.6% | 12.2% |
| Interquartile Range (IQR) | 7.2% | 7.8% |
| Standard Deviation (Sample) | 9.8% | 5.6% |
| Standard Deviation (Population) | 9.7% | 5.5% |
Similar Demographics by Child Poverty Under the Age of 16
Demographics Similar to Kenyans by Child Poverty Under the Age of 16
In terms of child poverty under the age of 16, the demographic groups most similar to Kenyans are Arab (16.6%, a difference of 0.36%), Immigrants from Morocco (16.6%, a difference of 0.38%), Immigrants from Bosnia and Herzegovina (16.5%, a difference of 0.43%), Immigrants from Western Asia (16.4%, a difference of 0.50%), and Celtic (16.4%, a difference of 0.52%).
| Demographics | Rating | Rank | Child Poverty Under the Age of 16 |
| Immigrants | Syria | 42.3 /100 | #179 | Average 16.4% |
| South American Indians | 41.8 /100 | #180 | Average 16.4% |
| Immigrants | South America | 40.8 /100 | #181 | Average 16.4% |
| Hawaiians | 38.2 /100 | #182 | Fair 16.4% |
| Celtics | 38.2 /100 | #183 | Fair 16.4% |
| Immigrants | Western Asia | 38.0 /100 | #184 | Fair 16.4% |
| Immigrants | Bosnia and Herzegovina | 37.4 /100 | #185 | Fair 16.5% |
| Kenyans | 34.1 /100 | #186 | Fair 16.5% |
| Arabs | 31.4 /100 | #187 | Fair 16.6% |
| Immigrants | Morocco | 31.2 /100 | #188 | Fair 16.6% |
| Immigrants | Portugal | 30.0 /100 | #189 | Fair 16.6% |
| Immigrants | Costa Rica | 29.6 /100 | #190 | Fair 16.6% |
| Immigrants | Iraq | 28.3 /100 | #191 | Fair 16.7% |
| Spanish | 24.5 /100 | #192 | Fair 16.7% |
| Spaniards | 23.2 /100 | #193 | Fair 16.8% |
Demographics Similar to Immigrants from Iran by Child Poverty Under the Age of 16
In terms of child poverty under the age of 16, the demographic groups most similar to Immigrants from Iran are Immigrants from Singapore (12.4%, a difference of 0.11%), Immigrants from South Central Asia (12.5%, a difference of 1.2%), Bhutanese (12.5%, a difference of 1.2%), Iranian (12.2%, a difference of 1.2%), and Immigrants from Hong Kong (12.1%, a difference of 2.0%).
| Demographics | Rating | Rank | Child Poverty Under the Age of 16 |
| Immigrants | Taiwan | 100.0 /100 | #2 | Exceptional 11.0% |
| Filipinos | 100.0 /100 | #3 | Exceptional 11.1% |
| Thais | 100.0 /100 | #4 | Exceptional 11.6% |
| Chinese | 100.0 /100 | #5 | Exceptional 11.9% |
| Immigrants | Hong Kong | 100.0 /100 | #6 | Exceptional 12.1% |
| Iranians | 100.0 /100 | #7 | Exceptional 12.2% |
| Immigrants | Singapore | 100.0 /100 | #8 | Exceptional 12.4% |
| Immigrants | Iran | 100.0 /100 | #9 | Exceptional 12.4% |
| Immigrants | South Central Asia | 99.9 /100 | #10 | Exceptional 12.5% |
| Bhutanese | 99.9 /100 | #11 | Exceptional 12.5% |
| Immigrants | Ireland | 99.9 /100 | #12 | Exceptional 12.7% |
| Burmese | 99.9 /100 | #13 | Exceptional 12.8% |
| Immigrants | Lithuania | 99.9 /100 | #14 | Exceptional 12.9% |
| Immigrants | Korea | 99.9 /100 | #15 | Exceptional 13.0% |
| Norwegians | 99.9 /100 | #16 | Exceptional 13.0% |