Kenyan vs Finnish Self-Care Disability
COMPARE
Kenyan
Finnish
Self-Care Disability
Self-Care Disability Comparison
Kenyans
Finns
2.3%
SELF-CARE DISABILITY
99.7/ 100
METRIC RATING
51st/ 347
METRIC RANK
2.4%
SELF-CARE DISABILITY
67.0/ 100
METRIC RATING
160th/ 347
METRIC RANK
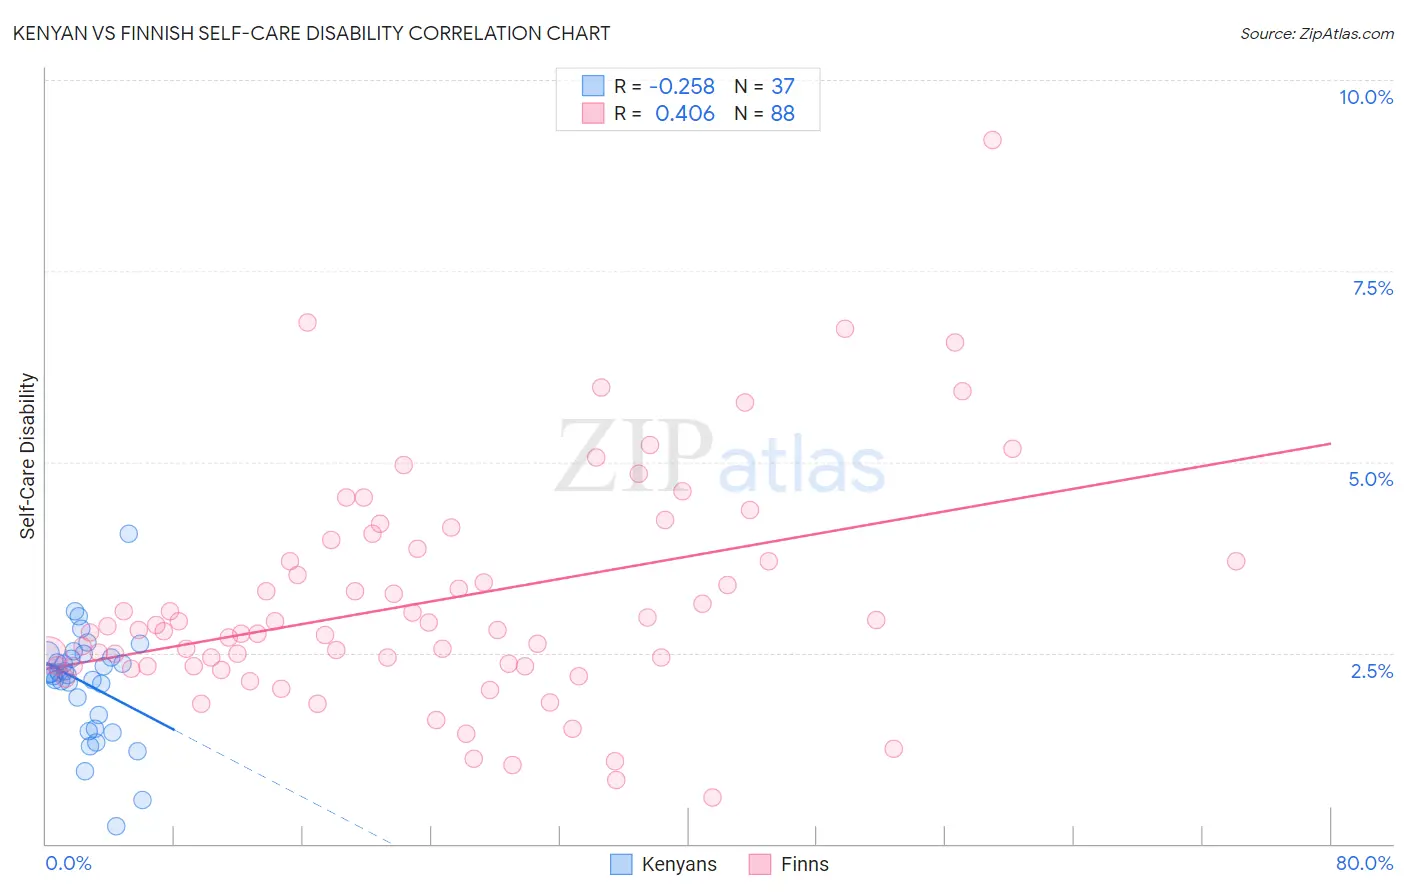
Kenyan vs Finnish Self-Care Disability Correlation Chart
The statistical analysis conducted on geographies consisting of 168,082,411 people shows a weak negative correlation between the proportion of Kenyans and percentage of population with self-care disability in the United States with a correlation coefficient (R) of -0.258 and weighted average of 2.3%. Similarly, the statistical analysis conducted on geographies consisting of 404,111,559 people shows a moderate positive correlation between the proportion of Finns and percentage of population with self-care disability in the United States with a correlation coefficient (R) of 0.406 and weighted average of 2.4%, a difference of 6.3%.
Self-Care Disability Correlation Summary
| Measurement | Kenyan | Finnish |
| Minimum | 0.23% | 0.60% |
| Maximum | 4.1% | 9.2% |
| Range | 3.8% | 8.6% |
| Mean | 2.1% | 3.2% |
| Median | 2.2% | 2.8% |
| Interquartile 25% (IQ1) | 1.6% | 2.3% |
| Interquartile 75% (IQ3) | 2.5% | 3.8% |
| Interquartile Range (IQR) | 0.87% | 1.5% |
| Standard Deviation (Sample) | 0.71% | 1.5% |
| Standard Deviation (Population) | 0.70% | 1.5% |
Similar Demographics by Self-Care Disability
Demographics Similar to Kenyans by Self-Care Disability
In terms of self-care disability, the demographic groups most similar to Kenyans are Immigrants from Serbia (2.3%, a difference of 0.020%), Australian (2.3%, a difference of 0.060%), Argentinean (2.3%, a difference of 0.10%), Immigrants from Brazil (2.3%, a difference of 0.15%), and Latvian (2.3%, a difference of 0.17%).
| Demographics | Rating | Rank | Self-Care Disability |
| Immigrants | South Africa | 99.8 /100 | #44 | Exceptional 2.3% |
| Norwegians | 99.8 /100 | #45 | Exceptional 2.3% |
| Czechs | 99.8 /100 | #46 | Exceptional 2.3% |
| Jordanians | 99.7 /100 | #47 | Exceptional 2.3% |
| Immigrants | Malaysia | 99.7 /100 | #48 | Exceptional 2.3% |
| Latvians | 99.7 /100 | #49 | Exceptional 2.3% |
| Immigrants | Brazil | 99.7 /100 | #50 | Exceptional 2.3% |
| Kenyans | 99.7 /100 | #51 | Exceptional 2.3% |
| Immigrants | Serbia | 99.6 /100 | #52 | Exceptional 2.3% |
| Australians | 99.6 /100 | #53 | Exceptional 2.3% |
| Argentineans | 99.6 /100 | #54 | Exceptional 2.3% |
| Immigrants | France | 99.6 /100 | #55 | Exceptional 2.3% |
| Immigrants | Eastern Asia | 99.6 /100 | #56 | Exceptional 2.3% |
| Immigrants | Belgium | 99.6 /100 | #57 | Exceptional 2.3% |
| Immigrants | Cameroon | 99.6 /100 | #58 | Exceptional 2.3% |
Demographics Similar to Finns by Self-Care Disability
In terms of self-care disability, the demographic groups most similar to Finns are Lebanese (2.4%, a difference of 0.030%), Immigrants from Italy (2.4%, a difference of 0.080%), Immigrants from Western Europe (2.4%, a difference of 0.090%), Immigrants from Europe (2.4%, a difference of 0.14%), and Somali (2.5%, a difference of 0.17%).
| Demographics | Rating | Rank | Self-Care Disability |
| Immigrants | England | 73.5 /100 | #153 | Good 2.4% |
| Italians | 72.2 /100 | #154 | Good 2.4% |
| Pakistanis | 71.4 /100 | #155 | Good 2.4% |
| Nigerians | 70.6 /100 | #156 | Good 2.4% |
| Immigrants | Europe | 69.6 /100 | #157 | Good 2.4% |
| Immigrants | Western Europe | 68.6 /100 | #158 | Good 2.4% |
| Immigrants | Italy | 68.5 /100 | #159 | Good 2.4% |
| Finns | 67.0 /100 | #160 | Good 2.4% |
| Lebanese | 66.5 /100 | #161 | Good 2.4% |
| Somalis | 63.7 /100 | #162 | Good 2.5% |
| German Russians | 62.7 /100 | #163 | Good 2.5% |
| Immigrants | Vietnam | 59.3 /100 | #164 | Average 2.5% |
| Syrians | 59.0 /100 | #165 | Average 2.5% |
| Canadians | 58.8 /100 | #166 | Average 2.5% |
| Immigrants | Greece | 57.3 /100 | #167 | Average 2.5% |