Immigrants from Argentina vs Immigrants from Iran Self-Care Disability
COMPARE
Immigrants from Argentina
Immigrants from Iran
Self-Care Disability
Self-Care Disability Comparison
Immigrants from Argentina
Immigrants from Iran
2.3%
SELF-CARE DISABILITY
99.3/ 100
METRIC RATING
66th/ 347
METRIC RANK
2.7%
SELF-CARE DISABILITY
0.2/ 100
METRIC RATING
264th/ 347
METRIC RANK
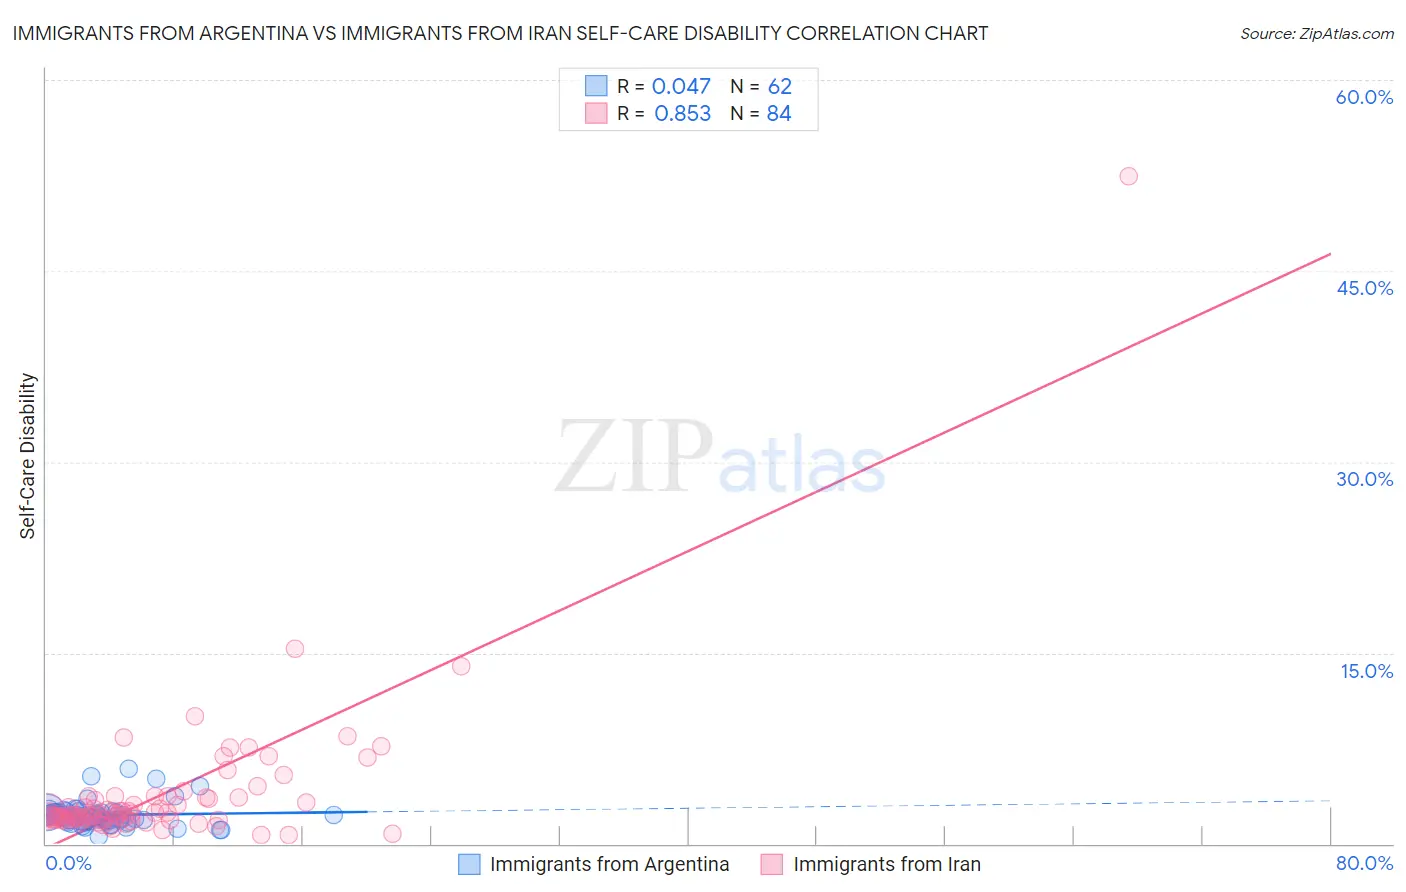
Immigrants from Argentina vs Immigrants from Iran Self-Care Disability Correlation Chart
The statistical analysis conducted on geographies consisting of 264,279,860 people shows no correlation between the proportion of Immigrants from Argentina and percentage of population with self-care disability in the United States with a correlation coefficient (R) of 0.047 and weighted average of 2.3%. Similarly, the statistical analysis conducted on geographies consisting of 279,736,483 people shows a very strong positive correlation between the proportion of Immigrants from Iran and percentage of population with self-care disability in the United States with a correlation coefficient (R) of 0.853 and weighted average of 2.7%, a difference of 14.3%.
Self-Care Disability Correlation Summary
| Measurement | Immigrants from Argentina | Immigrants from Iran |
| Minimum | 0.61% | 0.72% |
| Maximum | 5.8% | 52.5% |
| Range | 5.2% | 51.8% |
| Mean | 2.3% | 3.9% |
| Median | 2.1% | 2.3% |
| Interquartile 25% (IQ1) | 1.8% | 1.9% |
| Interquartile 75% (IQ3) | 2.5% | 3.6% |
| Interquartile Range (IQR) | 0.66% | 1.7% |
| Standard Deviation (Sample) | 0.95% | 6.0% |
| Standard Deviation (Population) | 0.94% | 5.9% |
Similar Demographics by Self-Care Disability
Demographics Similar to Immigrants from Argentina by Self-Care Disability
In terms of self-care disability, the demographic groups most similar to Immigrants from Argentina are Brazilian (2.3%, a difference of 0.030%), South African (2.3%, a difference of 0.030%), Swedish (2.3%, a difference of 0.090%), Mongolian (2.3%, a difference of 0.10%), and Immigrants from Zaire (2.3%, a difference of 0.12%).
| Demographics | Rating | Rank | Self-Care Disability |
| New Zealanders | 99.5 /100 | #59 | Exceptional 2.3% |
| Immigrants | Japan | 99.5 /100 | #60 | Exceptional 2.3% |
| Palestinians | 99.4 /100 | #61 | Exceptional 2.3% |
| Egyptians | 99.4 /100 | #62 | Exceptional 2.3% |
| Mongolians | 99.3 /100 | #63 | Exceptional 2.3% |
| Swedes | 99.3 /100 | #64 | Exceptional 2.3% |
| Brazilians | 99.3 /100 | #65 | Exceptional 2.3% |
| Immigrants | Argentina | 99.3 /100 | #66 | Exceptional 2.3% |
| South Africans | 99.3 /100 | #67 | Exceptional 2.3% |
| Immigrants | Zaire | 99.2 /100 | #68 | Exceptional 2.3% |
| Immigrants | Norway | 99.2 /100 | #69 | Exceptional 2.3% |
| Immigrants | Northern Europe | 99.2 /100 | #70 | Exceptional 2.3% |
| Asians | 99.2 /100 | #71 | Exceptional 2.3% |
| Eastern Europeans | 99.2 /100 | #72 | Exceptional 2.3% |
| Immigrants | Egypt | 99.1 /100 | #73 | Exceptional 2.3% |
Demographics Similar to Immigrants from Iran by Self-Care Disability
In terms of self-care disability, the demographic groups most similar to Immigrants from Iran are Immigrants from Latin America (2.7%, a difference of 0.060%), Shoshone (2.7%, a difference of 0.13%), Immigrants from Nicaragua (2.7%, a difference of 0.16%), Immigrants from Cambodia (2.7%, a difference of 0.21%), and Arapaho (2.6%, a difference of 0.27%).
| Demographics | Rating | Rank | Self-Care Disability |
| Potawatomi | 0.3 /100 | #257 | Tragic 2.6% |
| Immigrants | Nonimmigrants | 0.3 /100 | #258 | Tragic 2.6% |
| Immigrants | Belarus | 0.2 /100 | #259 | Tragic 2.6% |
| Chippewa | 0.2 /100 | #260 | Tragic 2.6% |
| Arapaho | 0.2 /100 | #261 | Tragic 2.6% |
| Shoshone | 0.2 /100 | #262 | Tragic 2.7% |
| Immigrants | Latin America | 0.2 /100 | #263 | Tragic 2.7% |
| Immigrants | Iran | 0.2 /100 | #264 | Tragic 2.7% |
| Immigrants | Nicaragua | 0.2 /100 | #265 | Tragic 2.7% |
| Immigrants | Cambodia | 0.1 /100 | #266 | Tragic 2.7% |
| Yaqui | 0.1 /100 | #267 | Tragic 2.7% |
| Immigrants | Mexico | 0.1 /100 | #268 | Tragic 2.7% |
| U.S. Virgin Islanders | 0.1 /100 | #269 | Tragic 2.7% |
| Immigrants | Micronesia | 0.1 /100 | #270 | Tragic 2.7% |
| Trinidadians and Tobagonians | 0.1 /100 | #271 | Tragic 2.7% |