Immigrants from England vs Immigrants from Sweden Disability Age 5 to 17
COMPARE
Immigrants from England
Immigrants from Sweden
Disability Age 5 to 17
Disability Age 5 to 17 Comparison
Immigrants from England
Immigrants from Sweden
5.6%
DISABILITY AGE 5 TO 17
36.4/ 100
METRIC RATING
181st/ 347
METRIC RANK
5.2%
DISABILITY AGE 5 TO 17
99.5/ 100
METRIC RATING
82nd/ 347
METRIC RANK
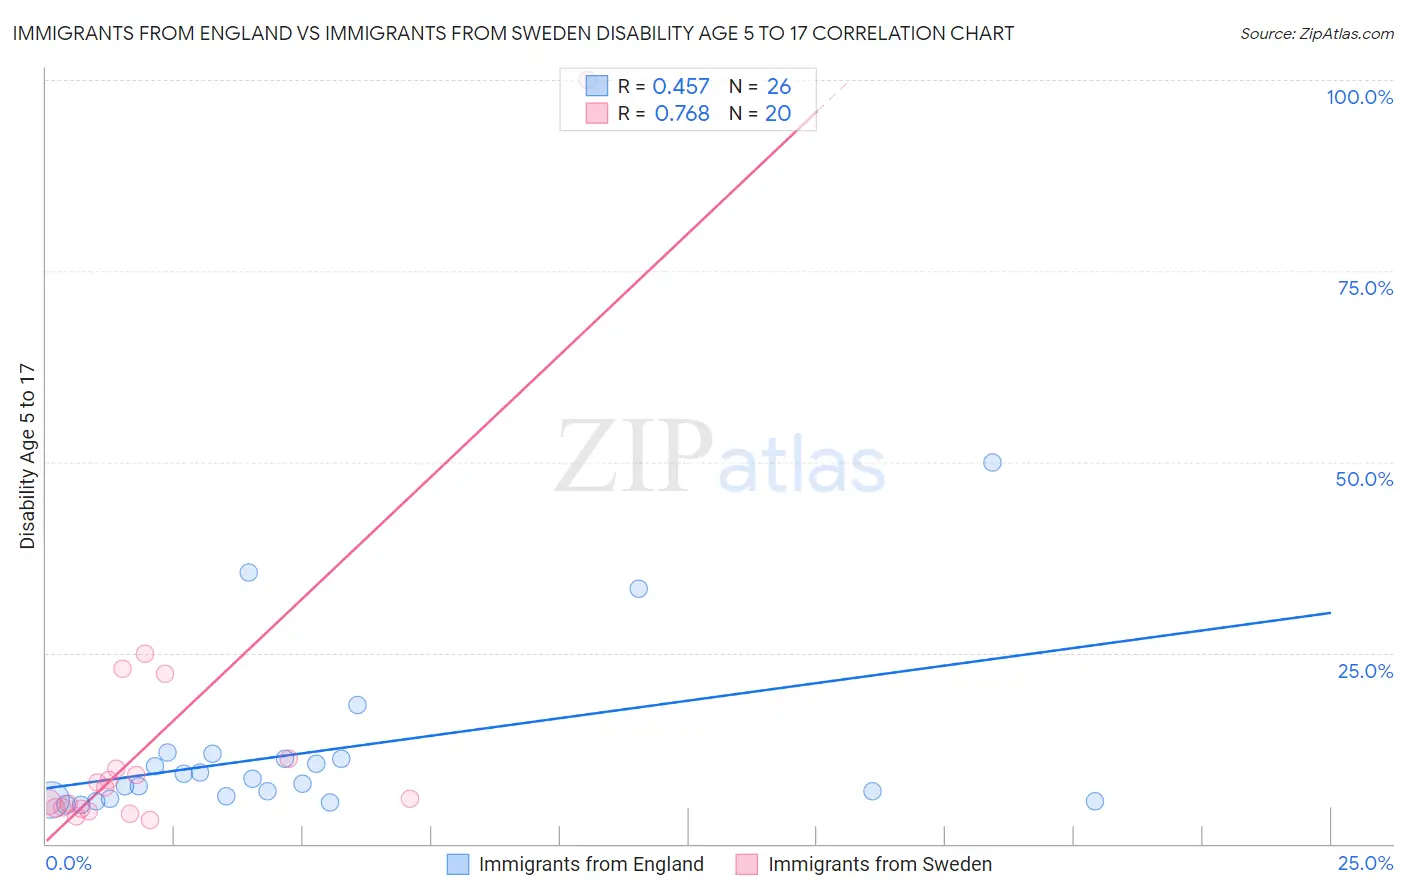
Immigrants from England vs Immigrants from Sweden Disability Age 5 to 17 Correlation Chart
The statistical analysis conducted on geographies consisting of 388,045,043 people shows a moderate positive correlation between the proportion of Immigrants from England and percentage of population with a disability between the ages 5 and 17 in the United States with a correlation coefficient (R) of 0.457 and weighted average of 5.6%. Similarly, the statistical analysis conducted on geographies consisting of 163,789,898 people shows a strong positive correlation between the proportion of Immigrants from Sweden and percentage of population with a disability between the ages 5 and 17 in the United States with a correlation coefficient (R) of 0.768 and weighted average of 5.2%, a difference of 7.8%.
Disability Age 5 to 17 Correlation Summary
| Measurement | Immigrants from England | Immigrants from Sweden |
| Minimum | 5.1% | 3.1% |
| Maximum | 50.0% | 100.0% |
| Range | 44.9% | 96.9% |
| Mean | 12.0% | 13.5% |
| Median | 8.2% | 6.6% |
| Interquartile 25% (IQ1) | 6.0% | 4.7% |
| Interquartile 75% (IQ3) | 11.1% | 10.4% |
| Interquartile Range (IQR) | 5.2% | 5.8% |
| Standard Deviation (Sample) | 10.9% | 21.4% |
| Standard Deviation (Population) | 10.7% | 20.9% |
Similar Demographics by Disability Age 5 to 17
Demographics Similar to Immigrants from England by Disability Age 5 to 17
In terms of disability age 5 to 17, the demographic groups most similar to Immigrants from England are Mexican American Indian (5.6%, a difference of 0.060%), Immigrants from Uruguay (5.6%, a difference of 0.070%), Immigrants from Latin America (5.6%, a difference of 0.11%), Syrian (5.6%, a difference of 0.14%), and Immigrants from Mexico (5.6%, a difference of 0.14%).
| Demographics | Rating | Rank | Disability Age 5 to 17 |
| Costa Ricans | 50.0 /100 | #174 | Average 5.6% |
| Shoshone | 49.4 /100 | #175 | Average 5.6% |
| Immigrants | Central America | 49.4 /100 | #176 | Average 5.6% |
| Immigrants | Western Europe | 47.8 /100 | #177 | Average 5.6% |
| Immigrants | Trinidad and Tobago | 47.6 /100 | #178 | Average 5.6% |
| Immigrants | Barbados | 40.5 /100 | #179 | Average 5.6% |
| Immigrants | Uruguay | 37.7 /100 | #180 | Fair 5.6% |
| Immigrants | England | 36.4 /100 | #181 | Fair 5.6% |
| Mexican American Indians | 35.2 /100 | #182 | Fair 5.6% |
| Immigrants | Latin America | 34.3 /100 | #183 | Fair 5.6% |
| Syrians | 33.8 /100 | #184 | Fair 5.6% |
| Immigrants | Mexico | 33.7 /100 | #185 | Fair 5.6% |
| Fijians | 31.7 /100 | #186 | Fair 5.7% |
| Immigrants | Thailand | 30.2 /100 | #187 | Fair 5.7% |
| Marshallese | 28.1 /100 | #188 | Fair 5.7% |
Demographics Similar to Immigrants from Sweden by Disability Age 5 to 17
In terms of disability age 5 to 17, the demographic groups most similar to Immigrants from Sweden are Immigrants from France (5.2%, a difference of 0.090%), Native Hawaiian (5.2%, a difference of 0.11%), Sri Lankan (5.2%, a difference of 0.15%), Immigrants from Nicaragua (5.2%, a difference of 0.16%), and Afghan (5.2%, a difference of 0.17%).
| Demographics | Rating | Rank | Disability Age 5 to 17 |
| Immigrants | Moldova | 99.6 /100 | #75 | Exceptional 5.2% |
| Immigrants | Guyana | 99.6 /100 | #76 | Exceptional 5.2% |
| Immigrants | Kazakhstan | 99.6 /100 | #77 | Exceptional 5.2% |
| Immigrants | Cuba | 99.6 /100 | #78 | Exceptional 5.2% |
| Afghans | 99.6 /100 | #79 | Exceptional 5.2% |
| Sri Lankans | 99.6 /100 | #80 | Exceptional 5.2% |
| Native Hawaiians | 99.6 /100 | #81 | Exceptional 5.2% |
| Immigrants | Sweden | 99.5 /100 | #82 | Exceptional 5.2% |
| Immigrants | France | 99.5 /100 | #83 | Exceptional 5.2% |
| Immigrants | Nicaragua | 99.5 /100 | #84 | Exceptional 5.2% |
| Bulgarians | 99.4 /100 | #85 | Exceptional 5.2% |
| Immigrants | St. Vincent and the Grenadines | 99.4 /100 | #86 | Exceptional 5.2% |
| Eastern Europeans | 99.4 /100 | #87 | Exceptional 5.2% |
| Immigrants | Croatia | 99.4 /100 | #88 | Exceptional 5.2% |
| Immigrants | Spain | 99.4 /100 | #89 | Exceptional 5.2% |