Finnish vs Immigrants from Sweden Disability Age 5 to 17
COMPARE
Finnish
Immigrants from Sweden
Disability Age 5 to 17
Disability Age 5 to 17 Comparison
Finns
Immigrants from Sweden
6.0%
DISABILITY AGE 5 TO 17
0.2/ 100
METRIC RATING
272nd/ 347
METRIC RANK
5.2%
DISABILITY AGE 5 TO 17
99.5/ 100
METRIC RATING
82nd/ 347
METRIC RANK
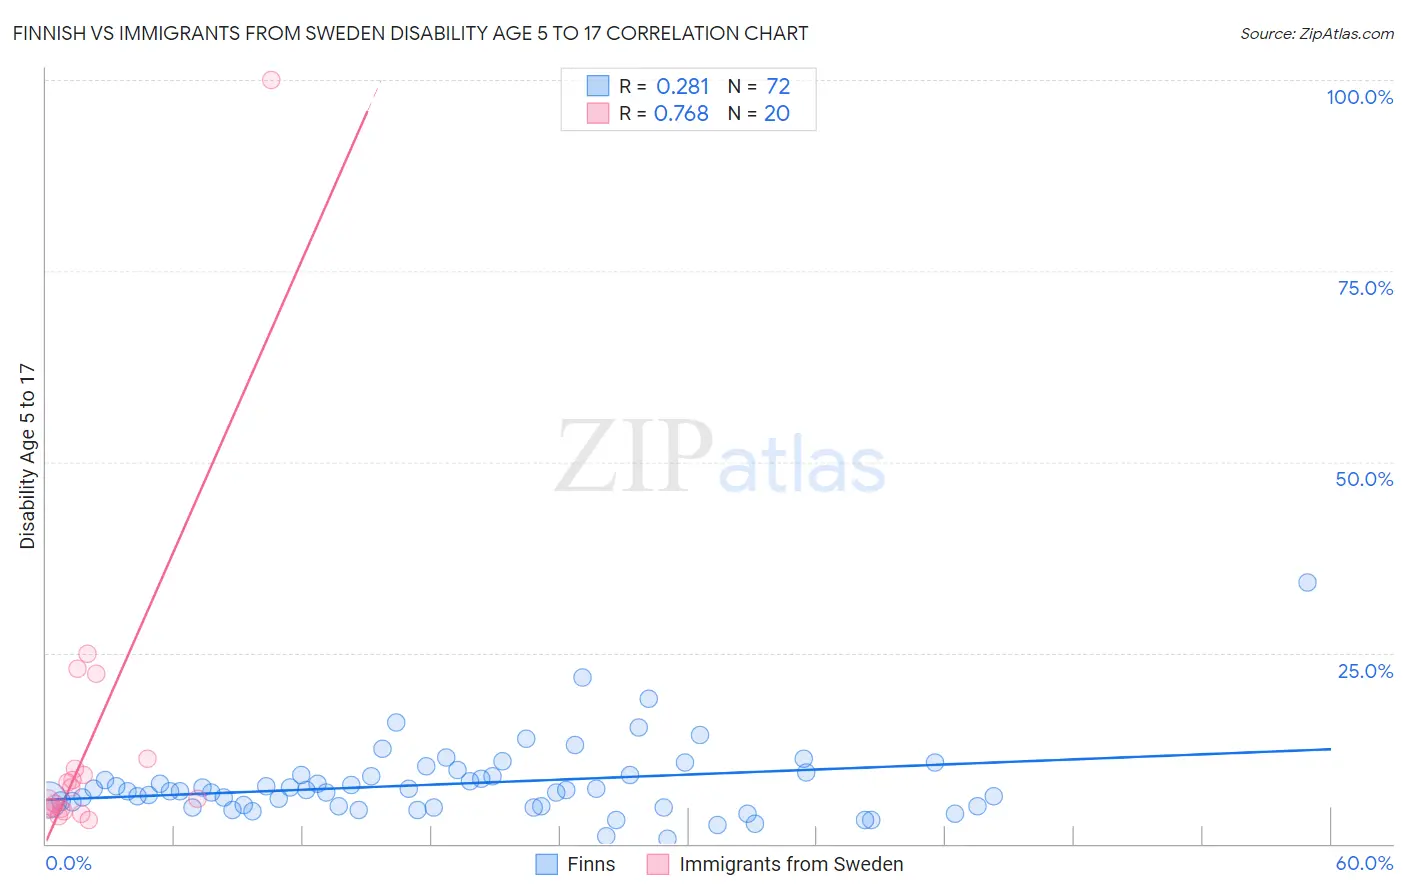
Finnish vs Immigrants from Sweden Disability Age 5 to 17 Correlation Chart
The statistical analysis conducted on geographies consisting of 400,280,382 people shows a weak positive correlation between the proportion of Finns and percentage of population with a disability between the ages 5 and 17 in the United States with a correlation coefficient (R) of 0.281 and weighted average of 6.0%. Similarly, the statistical analysis conducted on geographies consisting of 163,789,898 people shows a strong positive correlation between the proportion of Immigrants from Sweden and percentage of population with a disability between the ages 5 and 17 in the United States with a correlation coefficient (R) of 0.768 and weighted average of 5.2%, a difference of 15.3%.
Disability Age 5 to 17 Correlation Summary
| Measurement | Finnish | Immigrants from Sweden |
| Minimum | 0.71% | 3.1% |
| Maximum | 34.3% | 100.0% |
| Range | 33.6% | 96.9% |
| Mean | 7.9% | 13.5% |
| Median | 7.0% | 6.6% |
| Interquartile 25% (IQ1) | 4.9% | 4.7% |
| Interquartile 75% (IQ3) | 9.0% | 10.4% |
| Interquartile Range (IQR) | 4.1% | 5.8% |
| Standard Deviation (Sample) | 5.0% | 21.4% |
| Standard Deviation (Population) | 4.9% | 20.9% |
Similar Demographics by Disability Age 5 to 17
Demographics Similar to Finns by Disability Age 5 to 17
In terms of disability age 5 to 17, the demographic groups most similar to Finns are Immigrants from Zaire (6.0%, a difference of 0.030%), Alaska Native (6.0%, a difference of 0.050%), Cheyenne (6.0%, a difference of 0.16%), Dutch (6.0%, a difference of 0.27%), and Japanese (6.1%, a difference of 0.38%).
| Demographics | Rating | Rank | Disability Age 5 to 17 |
| Panamanians | 0.6 /100 | #265 | Tragic 6.0% |
| Slovenes | 0.6 /100 | #266 | Tragic 6.0% |
| Spanish | 0.5 /100 | #267 | Tragic 6.0% |
| Sioux | 0.4 /100 | #268 | Tragic 6.0% |
| Liberians | 0.4 /100 | #269 | Tragic 6.0% |
| Immigrants | Somalia | 0.4 /100 | #270 | Tragic 6.0% |
| Immigrants | Zaire | 0.2 /100 | #271 | Tragic 6.0% |
| Finns | 0.2 /100 | #272 | Tragic 6.0% |
| Alaska Natives | 0.2 /100 | #273 | Tragic 6.0% |
| Cheyenne | 0.2 /100 | #274 | Tragic 6.0% |
| Dutch | 0.2 /100 | #275 | Tragic 6.0% |
| Japanese | 0.1 /100 | #276 | Tragic 6.1% |
| Puget Sound Salish | 0.1 /100 | #277 | Tragic 6.1% |
| Immigrants | Liberia | 0.1 /100 | #278 | Tragic 6.1% |
| Immigrants | Jamaica | 0.1 /100 | #279 | Tragic 6.1% |
Demographics Similar to Immigrants from Sweden by Disability Age 5 to 17
In terms of disability age 5 to 17, the demographic groups most similar to Immigrants from Sweden are Immigrants from France (5.2%, a difference of 0.090%), Native Hawaiian (5.2%, a difference of 0.11%), Sri Lankan (5.2%, a difference of 0.15%), Immigrants from Nicaragua (5.2%, a difference of 0.16%), and Afghan (5.2%, a difference of 0.17%).
| Demographics | Rating | Rank | Disability Age 5 to 17 |
| Immigrants | Moldova | 99.6 /100 | #75 | Exceptional 5.2% |
| Immigrants | Guyana | 99.6 /100 | #76 | Exceptional 5.2% |
| Immigrants | Kazakhstan | 99.6 /100 | #77 | Exceptional 5.2% |
| Immigrants | Cuba | 99.6 /100 | #78 | Exceptional 5.2% |
| Afghans | 99.6 /100 | #79 | Exceptional 5.2% |
| Sri Lankans | 99.6 /100 | #80 | Exceptional 5.2% |
| Native Hawaiians | 99.6 /100 | #81 | Exceptional 5.2% |
| Immigrants | Sweden | 99.5 /100 | #82 | Exceptional 5.2% |
| Immigrants | France | 99.5 /100 | #83 | Exceptional 5.2% |
| Immigrants | Nicaragua | 99.5 /100 | #84 | Exceptional 5.2% |
| Bulgarians | 99.4 /100 | #85 | Exceptional 5.2% |
| Immigrants | St. Vincent and the Grenadines | 99.4 /100 | #86 | Exceptional 5.2% |
| Eastern Europeans | 99.4 /100 | #87 | Exceptional 5.2% |
| Immigrants | Croatia | 99.4 /100 | #88 | Exceptional 5.2% |
| Immigrants | Spain | 99.4 /100 | #89 | Exceptional 5.2% |