Immigrants from Zimbabwe vs Immigrants from the Azores Self-Care Disability
COMPARE
Immigrants from Zimbabwe
Immigrants from the Azores
Self-Care Disability
Self-Care Disability Comparison
Immigrants from Zimbabwe
Immigrants from the Azores
2.3%
SELF-CARE DISABILITY
99.9/ 100
METRIC RATING
29th/ 347
METRIC RANK
3.0%
SELF-CARE DISABILITY
0.0/ 100
METRIC RATING
335th/ 347
METRIC RANK
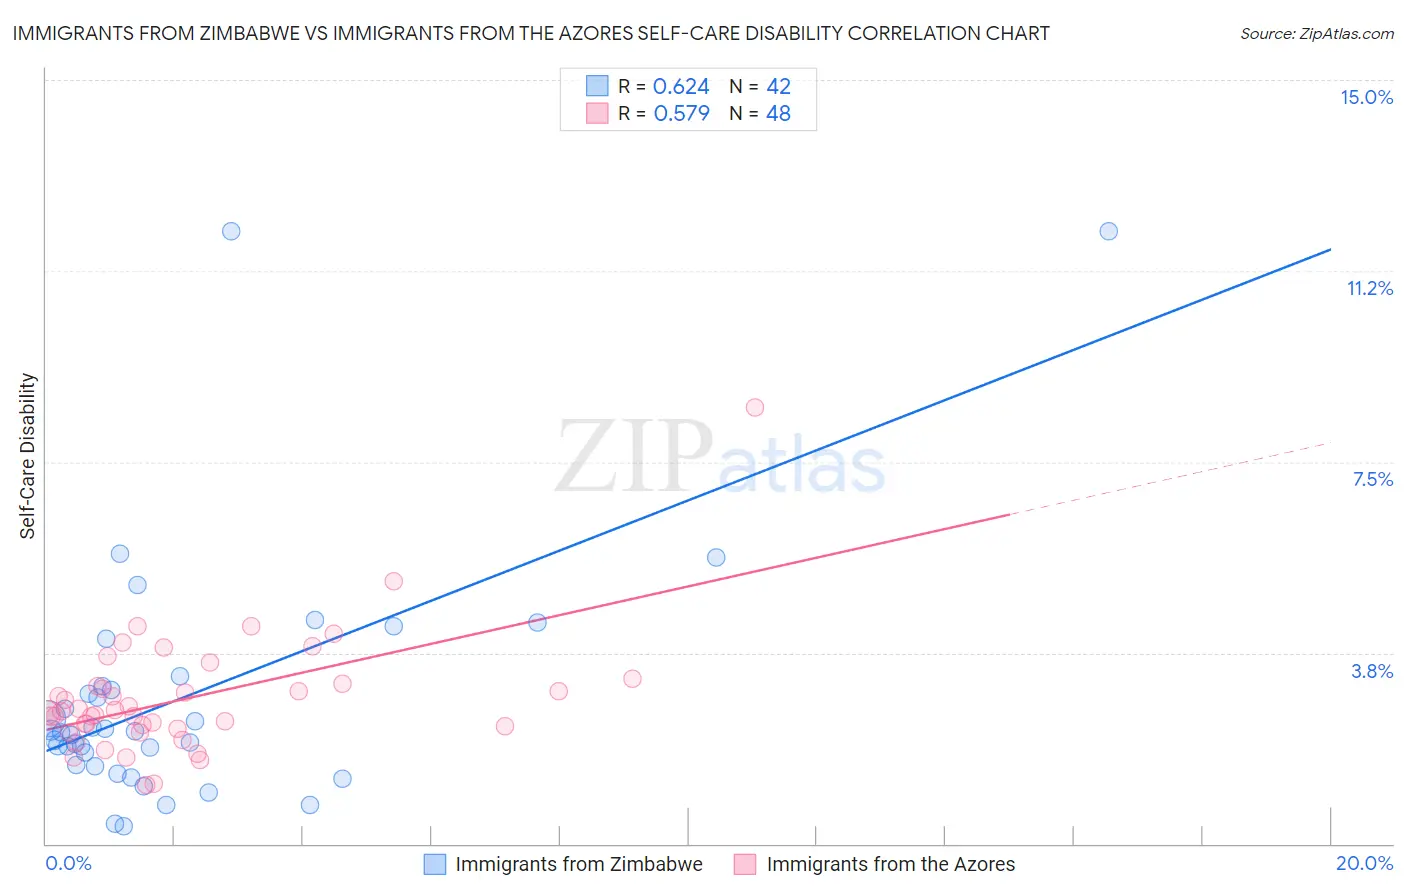
Immigrants from Zimbabwe vs Immigrants from the Azores Self-Care Disability Correlation Chart
The statistical analysis conducted on geographies consisting of 117,788,572 people shows a significant positive correlation between the proportion of Immigrants from Zimbabwe and percentage of population with self-care disability in the United States with a correlation coefficient (R) of 0.624 and weighted average of 2.3%. Similarly, the statistical analysis conducted on geographies consisting of 46,255,700 people shows a substantial positive correlation between the proportion of Immigrants from the Azores and percentage of population with self-care disability in the United States with a correlation coefficient (R) of 0.579 and weighted average of 3.0%, a difference of 32.8%.
Self-Care Disability Correlation Summary
| Measurement | Immigrants from Zimbabwe | Immigrants from the Azores |
| Minimum | 0.34% | 1.1% |
| Maximum | 12.0% | 8.6% |
| Range | 11.7% | 7.4% |
| Mean | 2.9% | 2.9% |
| Median | 2.2% | 2.6% |
| Interquartile 25% (IQ1) | 1.6% | 2.3% |
| Interquartile 75% (IQ3) | 3.1% | 3.1% |
| Interquartile Range (IQR) | 1.5% | 0.84% |
| Standard Deviation (Sample) | 2.4% | 1.2% |
| Standard Deviation (Population) | 2.4% | 1.2% |
Similar Demographics by Self-Care Disability
Demographics Similar to Immigrants from Zimbabwe by Self-Care Disability
In terms of self-care disability, the demographic groups most similar to Immigrants from Zimbabwe are Inupiat (2.2%, a difference of 0.090%), Venezuelan (2.2%, a difference of 0.25%), Immigrants from Sri Lanka (2.2%, a difference of 0.26%), Turkish (2.2%, a difference of 0.33%), and Paraguayan (2.3%, a difference of 0.33%).
| Demographics | Rating | Rank | Self-Care Disability |
| Immigrants | Venezuela | 100.0 /100 | #22 | Exceptional 2.2% |
| Cambodians | 100.0 /100 | #23 | Exceptional 2.2% |
| Cypriots | 100.0 /100 | #24 | Exceptional 2.2% |
| Turks | 100.0 /100 | #25 | Exceptional 2.2% |
| Immigrants | Sri Lanka | 99.9 /100 | #26 | Exceptional 2.2% |
| Venezuelans | 99.9 /100 | #27 | Exceptional 2.2% |
| Inupiat | 99.9 /100 | #28 | Exceptional 2.2% |
| Immigrants | Zimbabwe | 99.9 /100 | #29 | Exceptional 2.3% |
| Paraguayans | 99.9 /100 | #30 | Exceptional 2.3% |
| Danes | 99.9 /100 | #31 | Exceptional 2.3% |
| Burmese | 99.9 /100 | #32 | Exceptional 2.3% |
| Immigrants | Korea | 99.9 /100 | #33 | Exceptional 2.3% |
| Immigrants | Turkey | 99.9 /100 | #34 | Exceptional 2.3% |
| Immigrants | Australia | 99.9 /100 | #35 | Exceptional 2.3% |
| Immigrants | Lithuania | 99.9 /100 | #36 | Exceptional 2.3% |
Demographics Similar to Immigrants from the Azores by Self-Care Disability
In terms of self-care disability, the demographic groups most similar to Immigrants from the Azores are Houma (3.0%, a difference of 0.050%), Dutch West Indian (3.0%, a difference of 0.12%), Immigrants from Yemen (3.0%, a difference of 0.16%), Kiowa (3.0%, a difference of 0.35%), and Lumbee (3.0%, a difference of 0.71%).
| Demographics | Rating | Rank | Self-Care Disability |
| Hopi | 0.0 /100 | #328 | Tragic 2.9% |
| Cajuns | 0.0 /100 | #329 | Tragic 2.9% |
| Nepalese | 0.0 /100 | #330 | Tragic 3.0% |
| Lumbee | 0.0 /100 | #331 | Tragic 3.0% |
| Kiowa | 0.0 /100 | #332 | Tragic 3.0% |
| Dutch West Indians | 0.0 /100 | #333 | Tragic 3.0% |
| Houma | 0.0 /100 | #334 | Tragic 3.0% |
| Immigrants | Azores | 0.0 /100 | #335 | Tragic 3.0% |
| Immigrants | Yemen | 0.0 /100 | #336 | Tragic 3.0% |
| Choctaw | 0.0 /100 | #337 | Tragic 3.0% |
| Cape Verdeans | 0.0 /100 | #338 | Tragic 3.0% |
| Immigrants | Dominican Republic | 0.0 /100 | #339 | Tragic 3.0% |
| Immigrants | Cabo Verde | 0.0 /100 | #340 | Tragic 3.1% |
| Dominicans | 0.0 /100 | #341 | Tragic 3.1% |
| Colville | 0.0 /100 | #342 | Tragic 3.1% |