Immigrants from Zimbabwe vs Cuban Self-Care Disability
COMPARE
Immigrants from Zimbabwe
Cuban
Self-Care Disability
Self-Care Disability Comparison
Immigrants from Zimbabwe
Cubans
2.3%
SELF-CARE DISABILITY
99.9/ 100
METRIC RATING
29th/ 347
METRIC RANK
2.7%
SELF-CARE DISABILITY
0.0/ 100
METRIC RATING
290th/ 347
METRIC RANK
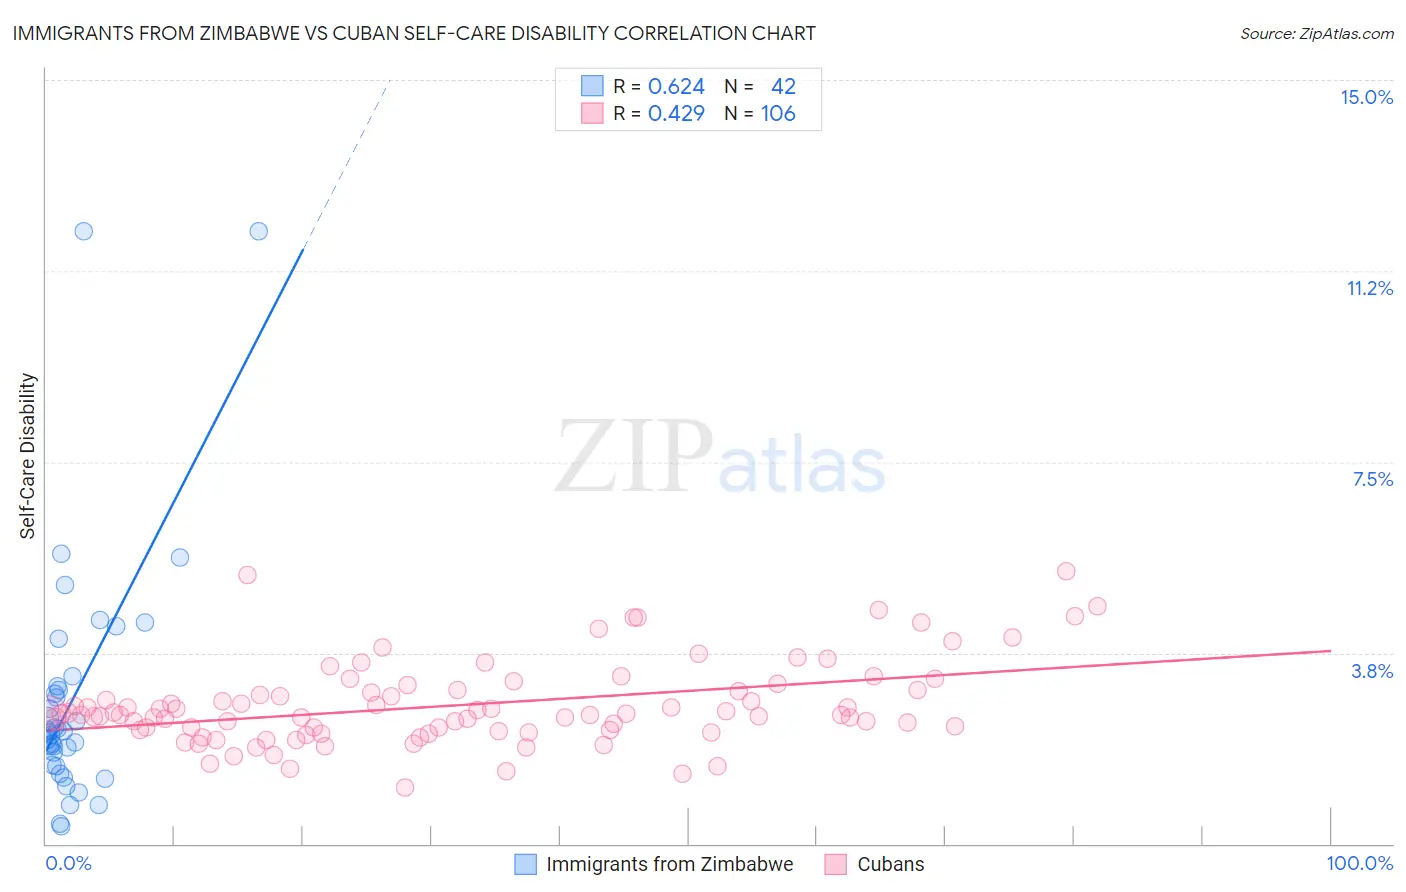
Immigrants from Zimbabwe vs Cuban Self-Care Disability Correlation Chart
The statistical analysis conducted on geographies consisting of 117,788,572 people shows a significant positive correlation between the proportion of Immigrants from Zimbabwe and percentage of population with self-care disability in the United States with a correlation coefficient (R) of 0.624 and weighted average of 2.3%. Similarly, the statistical analysis conducted on geographies consisting of 448,682,941 people shows a moderate positive correlation between the proportion of Cubans and percentage of population with self-care disability in the United States with a correlation coefficient (R) of 0.429 and weighted average of 2.7%, a difference of 21.3%.
Self-Care Disability Correlation Summary
| Measurement | Immigrants from Zimbabwe | Cuban |
| Minimum | 0.34% | 1.1% |
| Maximum | 12.0% | 5.4% |
| Range | 11.7% | 4.3% |
| Mean | 2.9% | 2.7% |
| Median | 2.2% | 2.5% |
| Interquartile 25% (IQ1) | 1.6% | 2.2% |
| Interquartile 75% (IQ3) | 3.1% | 3.0% |
| Interquartile Range (IQR) | 1.5% | 0.80% |
| Standard Deviation (Sample) | 2.4% | 0.82% |
| Standard Deviation (Population) | 2.4% | 0.81% |
Similar Demographics by Self-Care Disability
Demographics Similar to Immigrants from Zimbabwe by Self-Care Disability
In terms of self-care disability, the demographic groups most similar to Immigrants from Zimbabwe are Inupiat (2.2%, a difference of 0.090%), Venezuelan (2.2%, a difference of 0.25%), Immigrants from Sri Lanka (2.2%, a difference of 0.26%), Turkish (2.2%, a difference of 0.33%), and Paraguayan (2.3%, a difference of 0.33%).
| Demographics | Rating | Rank | Self-Care Disability |
| Immigrants | Venezuela | 100.0 /100 | #22 | Exceptional 2.2% |
| Cambodians | 100.0 /100 | #23 | Exceptional 2.2% |
| Cypriots | 100.0 /100 | #24 | Exceptional 2.2% |
| Turks | 100.0 /100 | #25 | Exceptional 2.2% |
| Immigrants | Sri Lanka | 99.9 /100 | #26 | Exceptional 2.2% |
| Venezuelans | 99.9 /100 | #27 | Exceptional 2.2% |
| Inupiat | 99.9 /100 | #28 | Exceptional 2.2% |
| Immigrants | Zimbabwe | 99.9 /100 | #29 | Exceptional 2.3% |
| Paraguayans | 99.9 /100 | #30 | Exceptional 2.3% |
| Danes | 99.9 /100 | #31 | Exceptional 2.3% |
| Burmese | 99.9 /100 | #32 | Exceptional 2.3% |
| Immigrants | Korea | 99.9 /100 | #33 | Exceptional 2.3% |
| Immigrants | Turkey | 99.9 /100 | #34 | Exceptional 2.3% |
| Immigrants | Australia | 99.9 /100 | #35 | Exceptional 2.3% |
| Immigrants | Lithuania | 99.9 /100 | #36 | Exceptional 2.3% |
Demographics Similar to Cubans by Self-Care Disability
In terms of self-care disability, the demographic groups most similar to Cubans are African (2.7%, a difference of 0.15%), Immigrants from Barbados (2.7%, a difference of 0.25%), Guyanese (2.7%, a difference of 0.26%), Immigrants from Jamaica (2.7%, a difference of 0.29%), and Central American Indian (2.7%, a difference of 0.42%).
| Demographics | Rating | Rank | Self-Care Disability |
| Delaware | 0.0 /100 | #283 | Tragic 2.7% |
| Fijians | 0.0 /100 | #284 | Tragic 2.7% |
| Jamaicans | 0.0 /100 | #285 | Tragic 2.7% |
| French American Indians | 0.0 /100 | #286 | Tragic 2.7% |
| Immigrants | Jamaica | 0.0 /100 | #287 | Tragic 2.7% |
| Immigrants | Barbados | 0.0 /100 | #288 | Tragic 2.7% |
| Africans | 0.0 /100 | #289 | Tragic 2.7% |
| Cubans | 0.0 /100 | #290 | Tragic 2.7% |
| Guyanese | 0.0 /100 | #291 | Tragic 2.7% |
| Central American Indians | 0.0 /100 | #292 | Tragic 2.7% |
| Belizeans | 0.0 /100 | #293 | Tragic 2.7% |
| Blackfeet | 0.0 /100 | #294 | Tragic 2.7% |
| Barbadians | 0.0 /100 | #295 | Tragic 2.7% |
| Immigrants | Portugal | 0.0 /100 | #296 | Tragic 2.8% |
| West Indians | 0.0 /100 | #297 | Tragic 2.8% |