Mongolian vs Immigrants from Bangladesh Disability Age 5 to 17
COMPARE
Mongolian
Immigrants from Bangladesh
Disability Age 5 to 17
Disability Age 5 to 17 Comparison
Mongolians
Immigrants from Bangladesh
5.3%
DISABILITY AGE 5 TO 17
99.2/ 100
METRIC RATING
91st/ 347
METRIC RANK
5.2%
DISABILITY AGE 5 TO 17
99.8/ 100
METRIC RATING
63rd/ 347
METRIC RANK
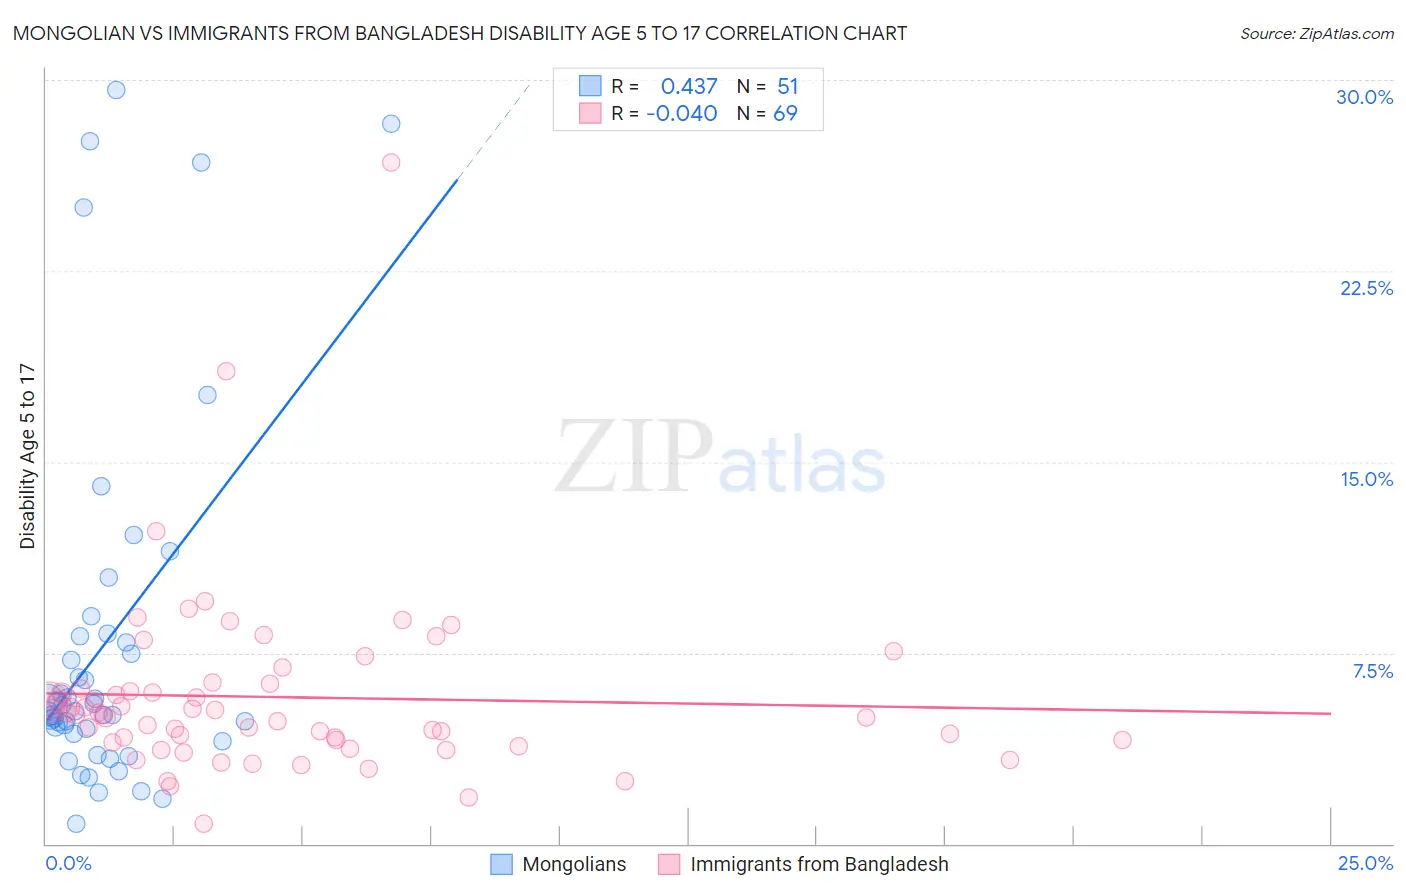
Mongolian vs Immigrants from Bangladesh Disability Age 5 to 17 Correlation Chart
The statistical analysis conducted on geographies consisting of 139,966,367 people shows a moderate positive correlation between the proportion of Mongolians and percentage of population with a disability between the ages 5 and 17 in the United States with a correlation coefficient (R) of 0.437 and weighted average of 5.3%. Similarly, the statistical analysis conducted on geographies consisting of 202,959,719 people shows no correlation between the proportion of Immigrants from Bangladesh and percentage of population with a disability between the ages 5 and 17 in the United States with a correlation coefficient (R) of -0.040 and weighted average of 5.2%, a difference of 1.8%.
Disability Age 5 to 17 Correlation Summary
| Measurement | Mongolian | Immigrants from Bangladesh |
| Minimum | 0.80% | 0.80% |
| Maximum | 29.6% | 26.8% |
| Range | 28.8% | 26.0% |
| Mean | 7.9% | 5.8% |
| Median | 5.2% | 5.1% |
| Interquartile 25% (IQ1) | 4.3% | 4.0% |
| Interquartile 75% (IQ3) | 8.1% | 6.2% |
| Interquartile Range (IQR) | 3.8% | 2.2% |
| Standard Deviation (Sample) | 7.2% | 3.7% |
| Standard Deviation (Population) | 7.1% | 3.6% |
Similar Demographics by Disability Age 5 to 17
Demographics Similar to Mongolians by Disability Age 5 to 17
In terms of disability age 5 to 17, the demographic groups most similar to Mongolians are Luxembourger (5.3%, a difference of 0.010%), Immigrants from Peru (5.3%, a difference of 0.090%), Immigrants from Jordan (5.3%, a difference of 0.16%), Immigrants from Grenada (5.3%, a difference of 0.18%), and Immigrants from Kuwait (5.3%, a difference of 0.29%).
| Demographics | Rating | Rank | Disability Age 5 to 17 |
| Immigrants | Nicaragua | 99.5 /100 | #84 | Exceptional 5.2% |
| Bulgarians | 99.4 /100 | #85 | Exceptional 5.2% |
| Immigrants | St. Vincent and the Grenadines | 99.4 /100 | #86 | Exceptional 5.2% |
| Eastern Europeans | 99.4 /100 | #87 | Exceptional 5.2% |
| Immigrants | Croatia | 99.4 /100 | #88 | Exceptional 5.2% |
| Immigrants | Spain | 99.4 /100 | #89 | Exceptional 5.2% |
| Immigrants | Kuwait | 99.4 /100 | #90 | Exceptional 5.3% |
| Mongolians | 99.2 /100 | #91 | Exceptional 5.3% |
| Luxembourgers | 99.2 /100 | #92 | Exceptional 5.3% |
| Immigrants | Peru | 99.1 /100 | #93 | Exceptional 5.3% |
| Immigrants | Jordan | 99.1 /100 | #94 | Exceptional 5.3% |
| Immigrants | Grenada | 99.1 /100 | #95 | Exceptional 5.3% |
| Immigrants | El Salvador | 99.0 /100 | #96 | Exceptional 5.3% |
| Immigrants | Europe | 99.0 /100 | #97 | Exceptional 5.3% |
| Immigrants | Austria | 98.9 /100 | #98 | Exceptional 5.3% |
Demographics Similar to Immigrants from Bangladesh by Disability Age 5 to 17
In terms of disability age 5 to 17, the demographic groups most similar to Immigrants from Bangladesh are Immigrants from South Eastern Asia (5.2%, a difference of 0.030%), Immigrants from Greece (5.2%, a difference of 0.040%), Palestinian (5.2%, a difference of 0.090%), Immigrants from Ireland (5.2%, a difference of 0.11%), and Macedonian (5.2%, a difference of 0.11%).
| Demographics | Rating | Rank | Disability Age 5 to 17 |
| Immigrants | Turkey | 99.9 /100 | #56 | Exceptional 5.1% |
| Immigrants | Poland | 99.9 /100 | #57 | Exceptional 5.1% |
| Immigrants | Ukraine | 99.9 /100 | #58 | Exceptional 5.1% |
| Immigrants | North Macedonia | 99.9 /100 | #59 | Exceptional 5.1% |
| Immigrants | Eastern Europe | 99.9 /100 | #60 | Exceptional 5.1% |
| Immigrants | Switzerland | 99.8 /100 | #61 | Exceptional 5.2% |
| Immigrants | Ireland | 99.8 /100 | #62 | Exceptional 5.2% |
| Immigrants | Bangladesh | 99.8 /100 | #63 | Exceptional 5.2% |
| Immigrants | South Eastern Asia | 99.8 /100 | #64 | Exceptional 5.2% |
| Immigrants | Greece | 99.8 /100 | #65 | Exceptional 5.2% |
| Palestinians | 99.8 /100 | #66 | Exceptional 5.2% |
| Macedonians | 99.8 /100 | #67 | Exceptional 5.2% |
| Immigrants | Syria | 99.7 /100 | #68 | Exceptional 5.2% |
| Guyanese | 99.7 /100 | #69 | Exceptional 5.2% |
| Immigrants | Belgium | 99.7 /100 | #70 | Exceptional 5.2% |