Immigrants from Czechoslovakia vs Immigrants from Bangladesh Disability Age 5 to 17
COMPARE
Immigrants from Czechoslovakia
Immigrants from Bangladesh
Disability Age 5 to 17
Disability Age 5 to 17 Comparison
Immigrants from Czechoslovakia
Immigrants from Bangladesh
5.2%
DISABILITY AGE 5 TO 17
99.7/ 100
METRIC RATING
73rd/ 347
METRIC RANK
5.2%
DISABILITY AGE 5 TO 17
99.8/ 100
METRIC RATING
63rd/ 347
METRIC RANK
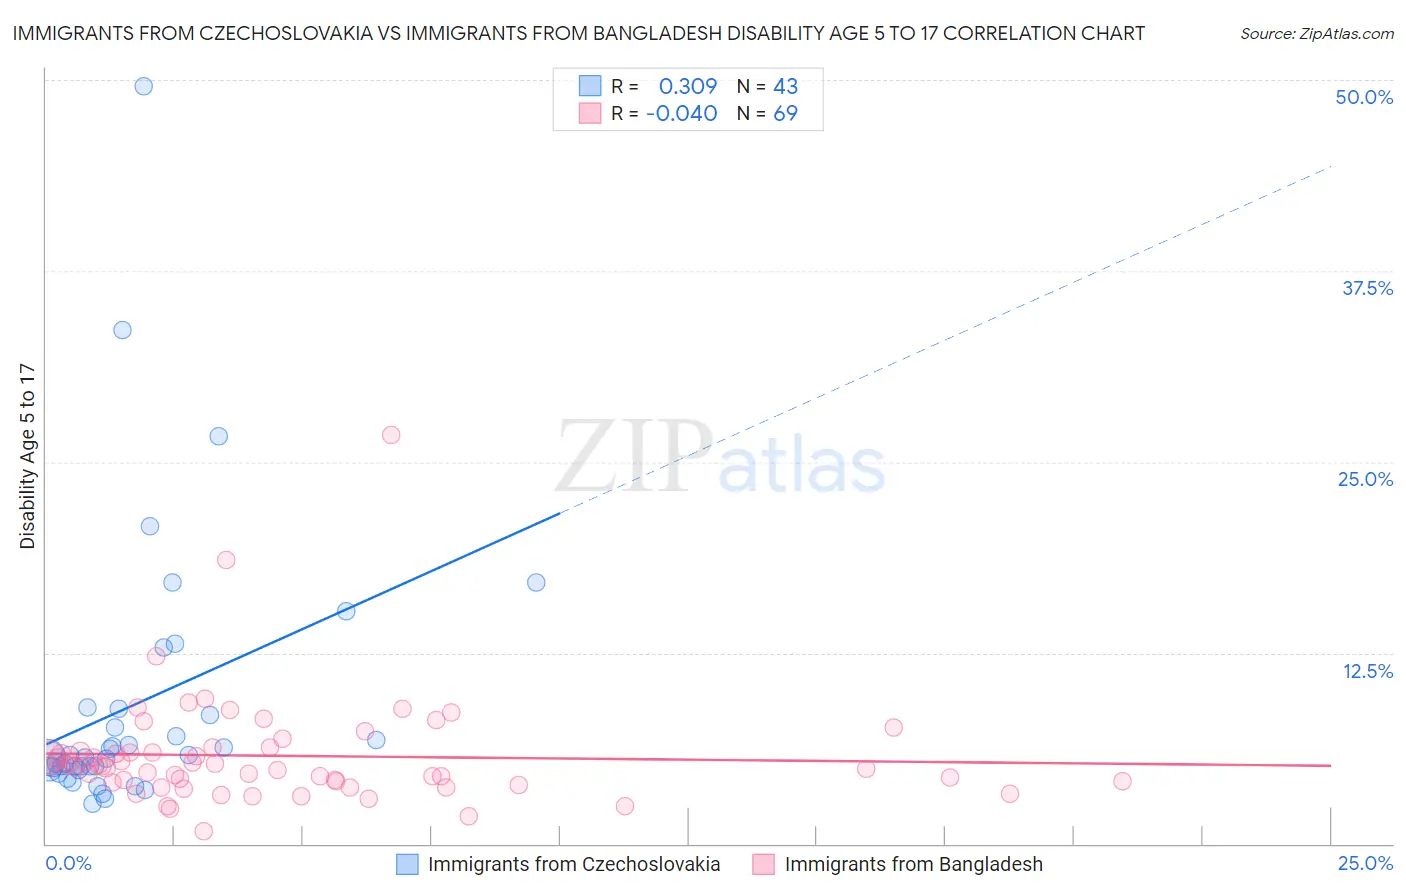
Immigrants from Czechoslovakia vs Immigrants from Bangladesh Disability Age 5 to 17 Correlation Chart
The statistical analysis conducted on geographies consisting of 194,293,746 people shows a mild positive correlation between the proportion of Immigrants from Czechoslovakia and percentage of population with a disability between the ages 5 and 17 in the United States with a correlation coefficient (R) of 0.309 and weighted average of 5.2%. Similarly, the statistical analysis conducted on geographies consisting of 202,959,719 people shows no correlation between the proportion of Immigrants from Bangladesh and percentage of population with a disability between the ages 5 and 17 in the United States with a correlation coefficient (R) of -0.040 and weighted average of 5.2%, a difference of 0.50%.
Disability Age 5 to 17 Correlation Summary
| Measurement | Immigrants from Czechoslovakia | Immigrants from Bangladesh |
| Minimum | 2.6% | 0.80% |
| Maximum | 49.6% | 26.8% |
| Range | 47.0% | 26.0% |
| Mean | 9.1% | 5.8% |
| Median | 5.7% | 5.1% |
| Interquartile 25% (IQ1) | 4.9% | 4.0% |
| Interquartile 75% (IQ3) | 8.8% | 6.2% |
| Interquartile Range (IQR) | 4.0% | 2.2% |
| Standard Deviation (Sample) | 9.0% | 3.7% |
| Standard Deviation (Population) | 8.9% | 3.6% |
Demographics Similar to Immigrants from Czechoslovakia and Immigrants from Bangladesh by Disability Age 5 to 17
In terms of disability age 5 to 17, the demographic groups most similar to Immigrants from Czechoslovakia are Immigrants from Vietnam (5.2%, a difference of 0.020%), Jordanian (5.2%, a difference of 0.050%), Immigrants from Romania (5.2%, a difference of 0.070%), Immigrants from Belgium (5.2%, a difference of 0.090%), and Guyanese (5.2%, a difference of 0.13%). Similarly, the demographic groups most similar to Immigrants from Bangladesh are Immigrants from South Eastern Asia (5.2%, a difference of 0.030%), Immigrants from Greece (5.2%, a difference of 0.040%), Palestinian (5.2%, a difference of 0.090%), Immigrants from Ireland (5.2%, a difference of 0.11%), and Macedonian (5.2%, a difference of 0.11%).
| Demographics | Rating | Rank | Disability Age 5 to 17 |
| Immigrants | Ukraine | 99.9 /100 | #58 | Exceptional 5.1% |
| Immigrants | North Macedonia | 99.9 /100 | #59 | Exceptional 5.1% |
| Immigrants | Eastern Europe | 99.9 /100 | #60 | Exceptional 5.1% |
| Immigrants | Switzerland | 99.8 /100 | #61 | Exceptional 5.2% |
| Immigrants | Ireland | 99.8 /100 | #62 | Exceptional 5.2% |
| Immigrants | Bangladesh | 99.8 /100 | #63 | Exceptional 5.2% |
| Immigrants | South Eastern Asia | 99.8 /100 | #64 | Exceptional 5.2% |
| Immigrants | Greece | 99.8 /100 | #65 | Exceptional 5.2% |
| Palestinians | 99.8 /100 | #66 | Exceptional 5.2% |
| Macedonians | 99.8 /100 | #67 | Exceptional 5.2% |
| Immigrants | Syria | 99.7 /100 | #68 | Exceptional 5.2% |
| Guyanese | 99.7 /100 | #69 | Exceptional 5.2% |
| Immigrants | Belgium | 99.7 /100 | #70 | Exceptional 5.2% |
| Jordanians | 99.7 /100 | #71 | Exceptional 5.2% |
| Immigrants | Vietnam | 99.7 /100 | #72 | Exceptional 5.2% |
| Immigrants | Czechoslovakia | 99.7 /100 | #73 | Exceptional 5.2% |
| Immigrants | Romania | 99.7 /100 | #74 | Exceptional 5.2% |
| Immigrants | Moldova | 99.6 /100 | #75 | Exceptional 5.2% |
| Immigrants | Guyana | 99.6 /100 | #76 | Exceptional 5.2% |
| Immigrants | Kazakhstan | 99.6 /100 | #77 | Exceptional 5.2% |
| Immigrants | Cuba | 99.6 /100 | #78 | Exceptional 5.2% |