Immigrants from Turkey vs Immigrants from France Disability Age 5 to 17
COMPARE
Immigrants from Turkey
Immigrants from France
Disability Age 5 to 17
Disability Age 5 to 17 Comparison
Immigrants from Turkey
Immigrants from France
5.1%
DISABILITY AGE 5 TO 17
99.9/ 100
METRIC RATING
56th/ 347
METRIC RANK
5.2%
DISABILITY AGE 5 TO 17
99.5/ 100
METRIC RATING
83rd/ 347
METRIC RANK
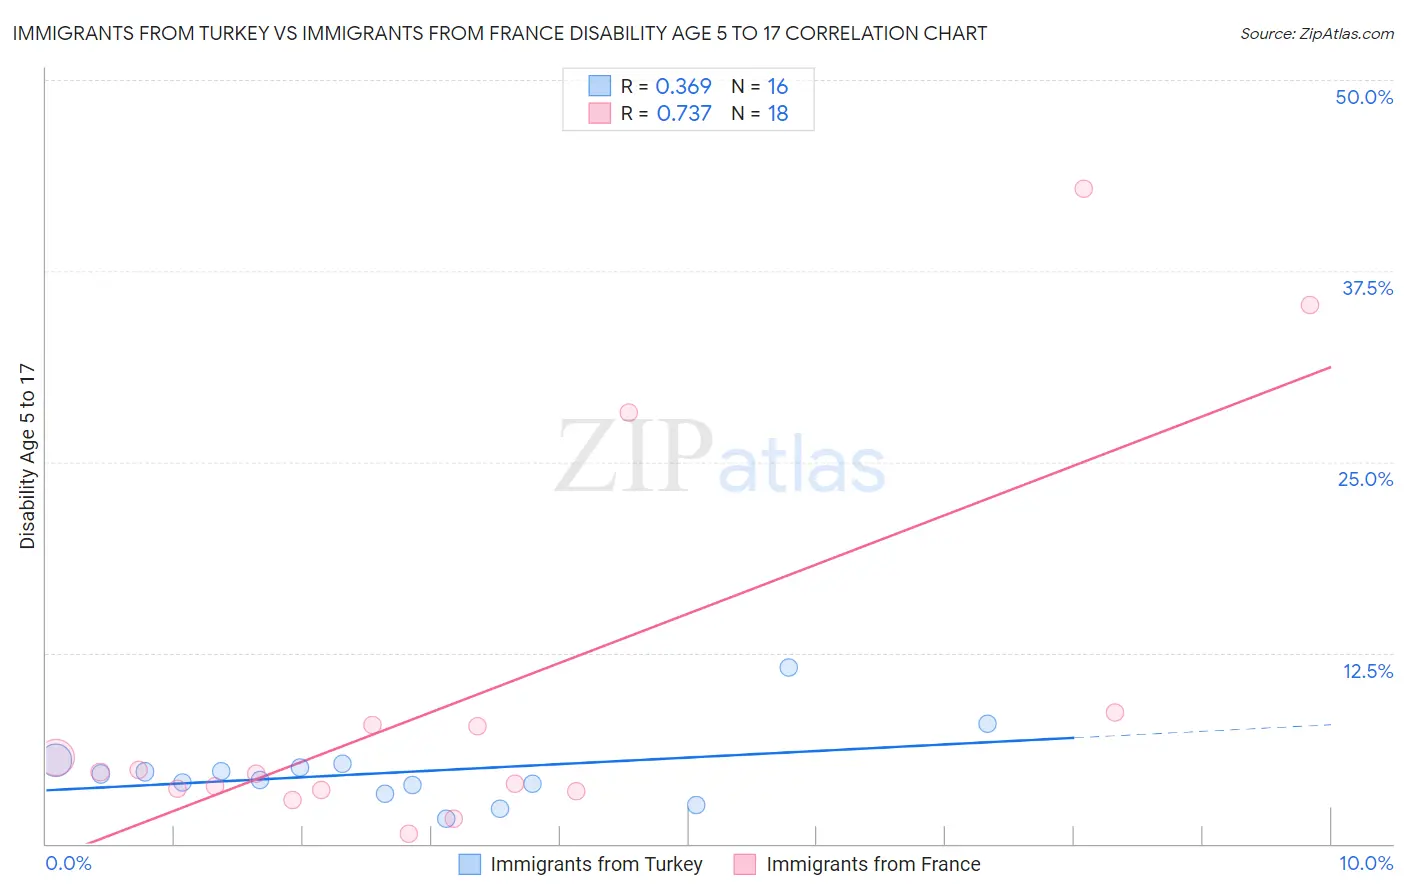
Immigrants from Turkey vs Immigrants from France Disability Age 5 to 17 Correlation Chart
The statistical analysis conducted on geographies consisting of 221,880,411 people shows a mild positive correlation between the proportion of Immigrants from Turkey and percentage of population with a disability between the ages 5 and 17 in the United States with a correlation coefficient (R) of 0.369 and weighted average of 5.1%. Similarly, the statistical analysis conducted on geographies consisting of 285,869,622 people shows a strong positive correlation between the proportion of Immigrants from France and percentage of population with a disability between the ages 5 and 17 in the United States with a correlation coefficient (R) of 0.737 and weighted average of 5.2%, a difference of 2.4%.
Disability Age 5 to 17 Correlation Summary
| Measurement | Immigrants from Turkey | Immigrants from France |
| Minimum | 1.6% | 0.63% |
| Maximum | 11.5% | 42.9% |
| Range | 9.9% | 42.2% |
| Mean | 4.7% | 9.6% |
| Median | 4.4% | 4.7% |
| Interquartile 25% (IQ1) | 3.6% | 3.5% |
| Interquartile 75% (IQ3) | 5.1% | 7.8% |
| Interquartile Range (IQR) | 1.5% | 4.2% |
| Standard Deviation (Sample) | 2.3% | 12.3% |
| Standard Deviation (Population) | 2.3% | 12.0% |
Similar Demographics by Disability Age 5 to 17
Demographics Similar to Immigrants from Turkey by Disability Age 5 to 17
In terms of disability age 5 to 17, the demographic groups most similar to Immigrants from Turkey are Laotian (5.1%, a difference of 0.010%), Paraguayan (5.1%, a difference of 0.060%), Immigrants from Lithuania (5.1%, a difference of 0.090%), Immigrants from Fiji (5.1%, a difference of 0.14%), and Immigrants from Poland (5.1%, a difference of 0.14%).
| Demographics | Rating | Rank | Disability Age 5 to 17 |
| Immigrants | Western Asia | 100.0 /100 | #49 | Exceptional 5.1% |
| Argentineans | 99.9 /100 | #50 | Exceptional 5.1% |
| Turks | 99.9 /100 | #51 | Exceptional 5.1% |
| Immigrants | Fiji | 99.9 /100 | #52 | Exceptional 5.1% |
| Immigrants | Lithuania | 99.9 /100 | #53 | Exceptional 5.1% |
| Paraguayans | 99.9 /100 | #54 | Exceptional 5.1% |
| Laotians | 99.9 /100 | #55 | Exceptional 5.1% |
| Immigrants | Turkey | 99.9 /100 | #56 | Exceptional 5.1% |
| Immigrants | Poland | 99.9 /100 | #57 | Exceptional 5.1% |
| Immigrants | Ukraine | 99.9 /100 | #58 | Exceptional 5.1% |
| Immigrants | North Macedonia | 99.9 /100 | #59 | Exceptional 5.1% |
| Immigrants | Eastern Europe | 99.9 /100 | #60 | Exceptional 5.1% |
| Immigrants | Switzerland | 99.8 /100 | #61 | Exceptional 5.2% |
| Immigrants | Ireland | 99.8 /100 | #62 | Exceptional 5.2% |
| Immigrants | Bangladesh | 99.8 /100 | #63 | Exceptional 5.2% |
Demographics Similar to Immigrants from France by Disability Age 5 to 17
In terms of disability age 5 to 17, the demographic groups most similar to Immigrants from France are Immigrants from Nicaragua (5.2%, a difference of 0.070%), Immigrants from Sweden (5.2%, a difference of 0.090%), Bulgarian (5.2%, a difference of 0.14%), Immigrants from St. Vincent and the Grenadines (5.2%, a difference of 0.18%), and Native Hawaiian (5.2%, a difference of 0.20%).
| Demographics | Rating | Rank | Disability Age 5 to 17 |
| Immigrants | Guyana | 99.6 /100 | #76 | Exceptional 5.2% |
| Immigrants | Kazakhstan | 99.6 /100 | #77 | Exceptional 5.2% |
| Immigrants | Cuba | 99.6 /100 | #78 | Exceptional 5.2% |
| Afghans | 99.6 /100 | #79 | Exceptional 5.2% |
| Sri Lankans | 99.6 /100 | #80 | Exceptional 5.2% |
| Native Hawaiians | 99.6 /100 | #81 | Exceptional 5.2% |
| Immigrants | Sweden | 99.5 /100 | #82 | Exceptional 5.2% |
| Immigrants | France | 99.5 /100 | #83 | Exceptional 5.2% |
| Immigrants | Nicaragua | 99.5 /100 | #84 | Exceptional 5.2% |
| Bulgarians | 99.4 /100 | #85 | Exceptional 5.2% |
| Immigrants | St. Vincent and the Grenadines | 99.4 /100 | #86 | Exceptional 5.2% |
| Eastern Europeans | 99.4 /100 | #87 | Exceptional 5.2% |
| Immigrants | Croatia | 99.4 /100 | #88 | Exceptional 5.2% |
| Immigrants | Spain | 99.4 /100 | #89 | Exceptional 5.2% |
| Immigrants | Kuwait | 99.4 /100 | #90 | Exceptional 5.3% |