Immigrants from Turkey vs Scotch-Irish Disability Age 5 to 17
COMPARE
Immigrants from Turkey
Scotch-Irish
Disability Age 5 to 17
Disability Age 5 to 17 Comparison
Immigrants from Turkey
Scotch-Irish
5.1%
DISABILITY AGE 5 TO 17
99.9/ 100
METRIC RATING
56th/ 347
METRIC RANK
6.3%
DISABILITY AGE 5 TO 17
0.0/ 100
METRIC RATING
308th/ 347
METRIC RANK
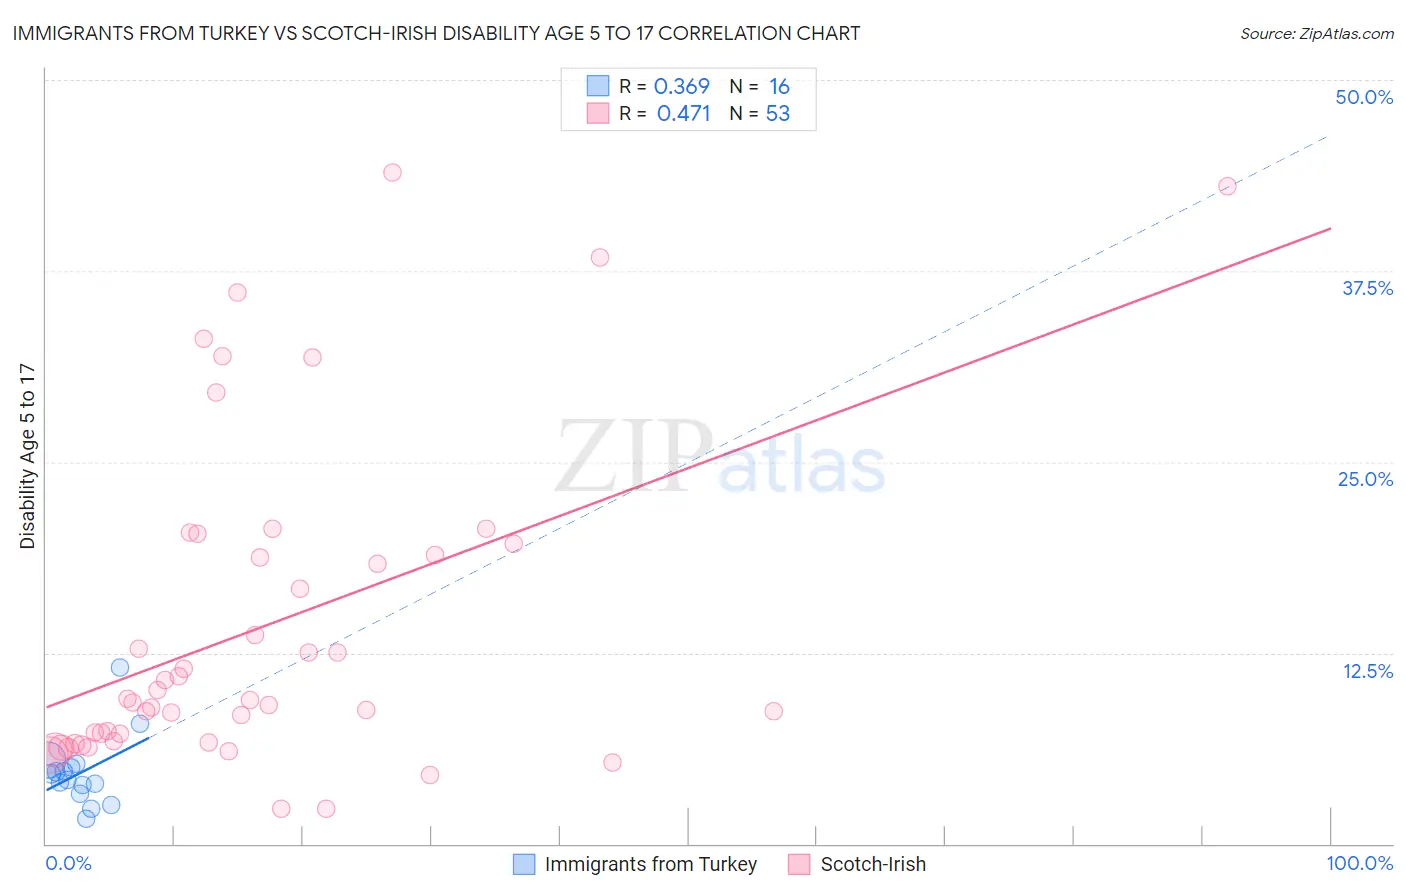
Immigrants from Turkey vs Scotch-Irish Disability Age 5 to 17 Correlation Chart
The statistical analysis conducted on geographies consisting of 221,880,411 people shows a mild positive correlation between the proportion of Immigrants from Turkey and percentage of population with a disability between the ages 5 and 17 in the United States with a correlation coefficient (R) of 0.369 and weighted average of 5.1%. Similarly, the statistical analysis conducted on geographies consisting of 537,256,381 people shows a moderate positive correlation between the proportion of Scotch-Irish and percentage of population with a disability between the ages 5 and 17 in the United States with a correlation coefficient (R) of 0.471 and weighted average of 6.3%, a difference of 23.9%.
Disability Age 5 to 17 Correlation Summary
| Measurement | Immigrants from Turkey | Scotch-Irish |
| Minimum | 1.6% | 2.3% |
| Maximum | 11.5% | 43.9% |
| Range | 9.9% | 41.6% |
| Mean | 4.7% | 14.2% |
| Median | 4.4% | 9.4% |
| Interquartile 25% (IQ1) | 3.6% | 6.7% |
| Interquartile 75% (IQ3) | 5.1% | 19.3% |
| Interquartile Range (IQR) | 1.5% | 12.6% |
| Standard Deviation (Sample) | 2.3% | 10.6% |
| Standard Deviation (Population) | 2.3% | 10.5% |
Similar Demographics by Disability Age 5 to 17
Demographics Similar to Immigrants from Turkey by Disability Age 5 to 17
In terms of disability age 5 to 17, the demographic groups most similar to Immigrants from Turkey are Laotian (5.1%, a difference of 0.010%), Paraguayan (5.1%, a difference of 0.060%), Immigrants from Lithuania (5.1%, a difference of 0.090%), Immigrants from Fiji (5.1%, a difference of 0.14%), and Immigrants from Poland (5.1%, a difference of 0.14%).
| Demographics | Rating | Rank | Disability Age 5 to 17 |
| Immigrants | Western Asia | 100.0 /100 | #49 | Exceptional 5.1% |
| Argentineans | 99.9 /100 | #50 | Exceptional 5.1% |
| Turks | 99.9 /100 | #51 | Exceptional 5.1% |
| Immigrants | Fiji | 99.9 /100 | #52 | Exceptional 5.1% |
| Immigrants | Lithuania | 99.9 /100 | #53 | Exceptional 5.1% |
| Paraguayans | 99.9 /100 | #54 | Exceptional 5.1% |
| Laotians | 99.9 /100 | #55 | Exceptional 5.1% |
| Immigrants | Turkey | 99.9 /100 | #56 | Exceptional 5.1% |
| Immigrants | Poland | 99.9 /100 | #57 | Exceptional 5.1% |
| Immigrants | Ukraine | 99.9 /100 | #58 | Exceptional 5.1% |
| Immigrants | North Macedonia | 99.9 /100 | #59 | Exceptional 5.1% |
| Immigrants | Eastern Europe | 99.9 /100 | #60 | Exceptional 5.1% |
| Immigrants | Switzerland | 99.8 /100 | #61 | Exceptional 5.2% |
| Immigrants | Ireland | 99.8 /100 | #62 | Exceptional 5.2% |
| Immigrants | Bangladesh | 99.8 /100 | #63 | Exceptional 5.2% |
Demographics Similar to Scotch-Irish by Disability Age 5 to 17
In terms of disability age 5 to 17, the demographic groups most similar to Scotch-Irish are Hmong (6.3%, a difference of 0.020%), Alaskan Athabascan (6.3%, a difference of 0.16%), Immigrants from Dominica (6.3%, a difference of 0.20%), Bahamian (6.3%, a difference of 0.23%), and Bermudan (6.4%, a difference of 0.32%).
| Demographics | Rating | Rank | Disability Age 5 to 17 |
| U.S. Virgin Islanders | 0.0 /100 | #301 | Tragic 6.3% |
| Celtics | 0.0 /100 | #302 | Tragic 6.3% |
| Yakama | 0.0 /100 | #303 | Tragic 6.3% |
| Senegalese | 0.0 /100 | #304 | Tragic 6.3% |
| Natives/Alaskans | 0.0 /100 | #305 | Tragic 6.3% |
| Immigrants | Nonimmigrants | 0.0 /100 | #306 | Tragic 6.3% |
| Bahamians | 0.0 /100 | #307 | Tragic 6.3% |
| Scotch-Irish | 0.0 /100 | #308 | Tragic 6.3% |
| Hmong | 0.0 /100 | #309 | Tragic 6.3% |
| Alaskan Athabascans | 0.0 /100 | #310 | Tragic 6.3% |
| Immigrants | Dominica | 0.0 /100 | #311 | Tragic 6.3% |
| Bermudans | 0.0 /100 | #312 | Tragic 6.4% |
| Apache | 0.0 /100 | #313 | Tragic 6.4% |
| French | 0.0 /100 | #314 | Tragic 6.4% |
| Immigrants | Portugal | 0.0 /100 | #315 | Tragic 6.4% |