Immigrants from Turkey vs Immigrants from Romania Disability Age 5 to 17
COMPARE
Immigrants from Turkey
Immigrants from Romania
Disability Age 5 to 17
Disability Age 5 to 17 Comparison
Immigrants from Turkey
Immigrants from Romania
5.1%
DISABILITY AGE 5 TO 17
99.9/ 100
METRIC RATING
56th/ 347
METRIC RANK
5.2%
DISABILITY AGE 5 TO 17
99.7/ 100
METRIC RATING
74th/ 347
METRIC RANK
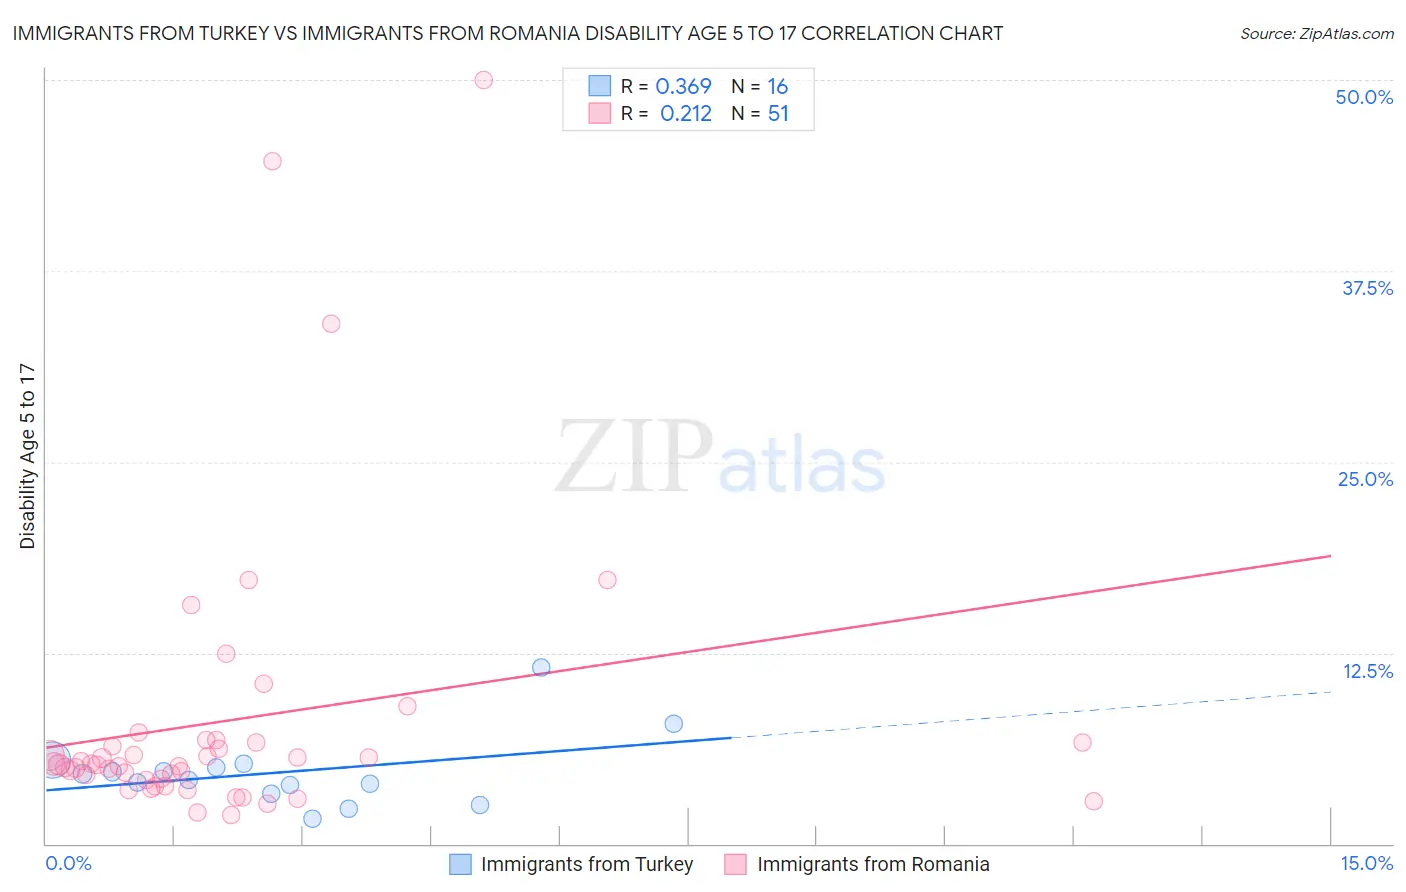
Immigrants from Turkey vs Immigrants from Romania Disability Age 5 to 17 Correlation Chart
The statistical analysis conducted on geographies consisting of 221,880,411 people shows a mild positive correlation between the proportion of Immigrants from Turkey and percentage of population with a disability between the ages 5 and 17 in the United States with a correlation coefficient (R) of 0.369 and weighted average of 5.1%. Similarly, the statistical analysis conducted on geographies consisting of 255,693,351 people shows a weak positive correlation between the proportion of Immigrants from Romania and percentage of population with a disability between the ages 5 and 17 in the United States with a correlation coefficient (R) of 0.212 and weighted average of 5.2%, a difference of 1.8%.
Disability Age 5 to 17 Correlation Summary
| Measurement | Immigrants from Turkey | Immigrants from Romania |
| Minimum | 1.6% | 1.9% |
| Maximum | 11.5% | 50.0% |
| Range | 9.9% | 48.1% |
| Mean | 4.7% | 8.1% |
| Median | 4.4% | 5.2% |
| Interquartile 25% (IQ1) | 3.6% | 4.2% |
| Interquartile 75% (IQ3) | 5.1% | 6.7% |
| Interquartile Range (IQR) | 1.5% | 2.5% |
| Standard Deviation (Sample) | 2.3% | 9.5% |
| Standard Deviation (Population) | 2.3% | 9.5% |
Demographics Similar to Immigrants from Turkey and Immigrants from Romania by Disability Age 5 to 17
In terms of disability age 5 to 17, the demographic groups most similar to Immigrants from Turkey are Laotian (5.1%, a difference of 0.010%), Immigrants from Poland (5.1%, a difference of 0.14%), Immigrants from Ukraine (5.1%, a difference of 0.23%), Immigrants from North Macedonia (5.1%, a difference of 0.41%), and Immigrants from Eastern Europe (5.1%, a difference of 0.52%). Similarly, the demographic groups most similar to Immigrants from Romania are Immigrants from Czechoslovakia (5.2%, a difference of 0.070%), Immigrants from Vietnam (5.2%, a difference of 0.090%), Jordanian (5.2%, a difference of 0.12%), Immigrants from Belgium (5.2%, a difference of 0.16%), and Guyanese (5.2%, a difference of 0.20%).
| Demographics | Rating | Rank | Disability Age 5 to 17 |
| Laotians | 99.9 /100 | #55 | Exceptional 5.1% |
| Immigrants | Turkey | 99.9 /100 | #56 | Exceptional 5.1% |
| Immigrants | Poland | 99.9 /100 | #57 | Exceptional 5.1% |
| Immigrants | Ukraine | 99.9 /100 | #58 | Exceptional 5.1% |
| Immigrants | North Macedonia | 99.9 /100 | #59 | Exceptional 5.1% |
| Immigrants | Eastern Europe | 99.9 /100 | #60 | Exceptional 5.1% |
| Immigrants | Switzerland | 99.8 /100 | #61 | Exceptional 5.2% |
| Immigrants | Ireland | 99.8 /100 | #62 | Exceptional 5.2% |
| Immigrants | Bangladesh | 99.8 /100 | #63 | Exceptional 5.2% |
| Immigrants | South Eastern Asia | 99.8 /100 | #64 | Exceptional 5.2% |
| Immigrants | Greece | 99.8 /100 | #65 | Exceptional 5.2% |
| Palestinians | 99.8 /100 | #66 | Exceptional 5.2% |
| Macedonians | 99.8 /100 | #67 | Exceptional 5.2% |
| Immigrants | Syria | 99.7 /100 | #68 | Exceptional 5.2% |
| Guyanese | 99.7 /100 | #69 | Exceptional 5.2% |
| Immigrants | Belgium | 99.7 /100 | #70 | Exceptional 5.2% |
| Jordanians | 99.7 /100 | #71 | Exceptional 5.2% |
| Immigrants | Vietnam | 99.7 /100 | #72 | Exceptional 5.2% |
| Immigrants | Czechoslovakia | 99.7 /100 | #73 | Exceptional 5.2% |
| Immigrants | Romania | 99.7 /100 | #74 | Exceptional 5.2% |
| Immigrants | Moldova | 99.6 /100 | #75 | Exceptional 5.2% |