Immigrants from Congo vs Immigrants from France Disability Age 5 to 17
COMPARE
Immigrants from Congo
Immigrants from France
Disability Age 5 to 17
Disability Age 5 to 17 Comparison
Immigrants from Congo
Immigrants from France
6.2%
DISABILITY AGE 5 TO 17
0.0/ 100
METRIC RATING
290th/ 347
METRIC RANK
5.2%
DISABILITY AGE 5 TO 17
99.5/ 100
METRIC RATING
83rd/ 347
METRIC RANK
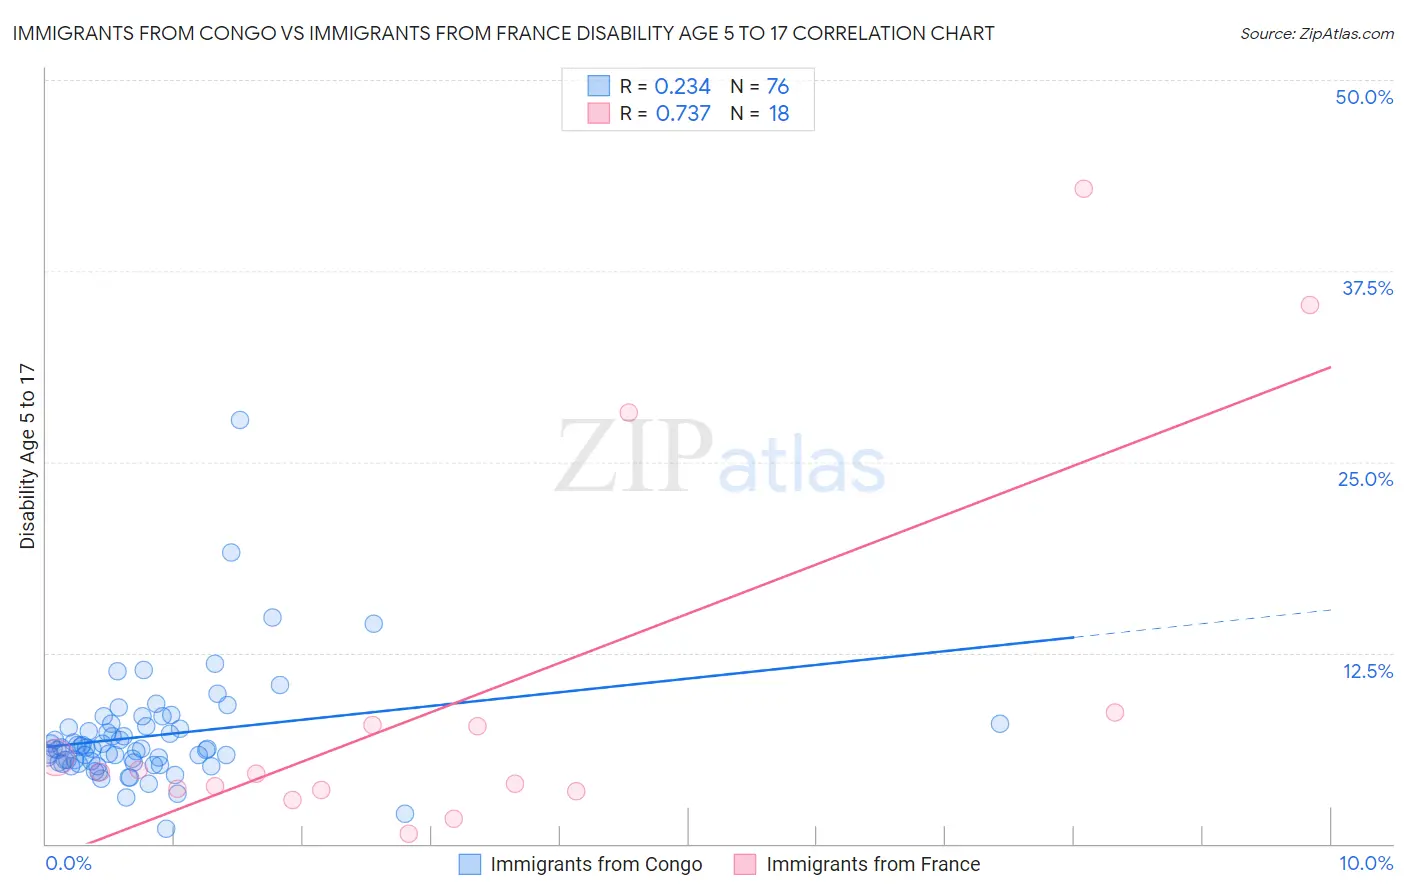
Immigrants from Congo vs Immigrants from France Disability Age 5 to 17 Correlation Chart
The statistical analysis conducted on geographies consisting of 91,997,133 people shows a weak positive correlation between the proportion of Immigrants from Congo and percentage of population with a disability between the ages 5 and 17 in the United States with a correlation coefficient (R) of 0.234 and weighted average of 6.2%. Similarly, the statistical analysis conducted on geographies consisting of 285,869,622 people shows a strong positive correlation between the proportion of Immigrants from France and percentage of population with a disability between the ages 5 and 17 in the United States with a correlation coefficient (R) of 0.737 and weighted average of 5.2%, a difference of 18.2%.
Disability Age 5 to 17 Correlation Summary
| Measurement | Immigrants from Congo | Immigrants from France |
| Minimum | 0.97% | 0.63% |
| Maximum | 27.7% | 42.9% |
| Range | 26.7% | 42.2% |
| Mean | 7.0% | 9.6% |
| Median | 6.2% | 4.7% |
| Interquartile 25% (IQ1) | 5.3% | 3.5% |
| Interquartile 75% (IQ3) | 7.7% | 7.8% |
| Interquartile Range (IQR) | 2.3% | 4.2% |
| Standard Deviation (Sample) | 3.6% | 12.3% |
| Standard Deviation (Population) | 3.6% | 12.0% |
Similar Demographics by Disability Age 5 to 17
Demographics Similar to Immigrants from Congo by Disability Age 5 to 17
In terms of disability age 5 to 17, the demographic groups most similar to Immigrants from Congo are Yaqui (6.2%, a difference of 0.0%), Jamaican (6.2%, a difference of 0.010%), White/Caucasian (6.2%, a difference of 0.15%), Pima (6.2%, a difference of 0.27%), and Immigrants from Senegal (6.2%, a difference of 0.39%).
| Demographics | Rating | Rank | Disability Age 5 to 17 |
| Ugandans | 0.0 /100 | #283 | Tragic 6.2% |
| Sub-Saharan Africans | 0.0 /100 | #284 | Tragic 6.2% |
| English | 0.0 /100 | #285 | Tragic 6.2% |
| Colville | 0.0 /100 | #286 | Tragic 6.2% |
| Pima | 0.0 /100 | #287 | Tragic 6.2% |
| Jamaicans | 0.0 /100 | #288 | Tragic 6.2% |
| Yaqui | 0.0 /100 | #289 | Tragic 6.2% |
| Immigrants | Congo | 0.0 /100 | #290 | Tragic 6.2% |
| Whites/Caucasians | 0.0 /100 | #291 | Tragic 6.2% |
| Immigrants | Senegal | 0.0 /100 | #292 | Tragic 6.2% |
| Central American Indians | 0.0 /100 | #293 | Tragic 6.2% |
| Irish | 0.0 /100 | #294 | Tragic 6.2% |
| Cree | 0.0 /100 | #295 | Tragic 6.2% |
| Spanish Americans | 0.0 /100 | #296 | Tragic 6.2% |
| Immigrants | Bahamas | 0.0 /100 | #297 | Tragic 6.2% |
Demographics Similar to Immigrants from France by Disability Age 5 to 17
In terms of disability age 5 to 17, the demographic groups most similar to Immigrants from France are Immigrants from Nicaragua (5.2%, a difference of 0.070%), Immigrants from Sweden (5.2%, a difference of 0.090%), Bulgarian (5.2%, a difference of 0.14%), Immigrants from St. Vincent and the Grenadines (5.2%, a difference of 0.18%), and Native Hawaiian (5.2%, a difference of 0.20%).
| Demographics | Rating | Rank | Disability Age 5 to 17 |
| Immigrants | Guyana | 99.6 /100 | #76 | Exceptional 5.2% |
| Immigrants | Kazakhstan | 99.6 /100 | #77 | Exceptional 5.2% |
| Immigrants | Cuba | 99.6 /100 | #78 | Exceptional 5.2% |
| Afghans | 99.6 /100 | #79 | Exceptional 5.2% |
| Sri Lankans | 99.6 /100 | #80 | Exceptional 5.2% |
| Native Hawaiians | 99.6 /100 | #81 | Exceptional 5.2% |
| Immigrants | Sweden | 99.5 /100 | #82 | Exceptional 5.2% |
| Immigrants | France | 99.5 /100 | #83 | Exceptional 5.2% |
| Immigrants | Nicaragua | 99.5 /100 | #84 | Exceptional 5.2% |
| Bulgarians | 99.4 /100 | #85 | Exceptional 5.2% |
| Immigrants | St. Vincent and the Grenadines | 99.4 /100 | #86 | Exceptional 5.2% |
| Eastern Europeans | 99.4 /100 | #87 | Exceptional 5.2% |
| Immigrants | Croatia | 99.4 /100 | #88 | Exceptional 5.2% |
| Immigrants | Spain | 99.4 /100 | #89 | Exceptional 5.2% |
| Immigrants | Kuwait | 99.4 /100 | #90 | Exceptional 5.3% |