Immigrants from Turkey vs Immigrants from France 9th Grade
COMPARE
Immigrants from Turkey
Immigrants from France
9th Grade
9th Grade Comparison
Immigrants from Turkey
Immigrants from France
95.4%
9TH GRADE
95.6/ 100
METRIC RATING
118th/ 347
METRIC RANK
95.5%
9TH GRADE
97.4/ 100
METRIC RATING
105th/ 347
METRIC RANK
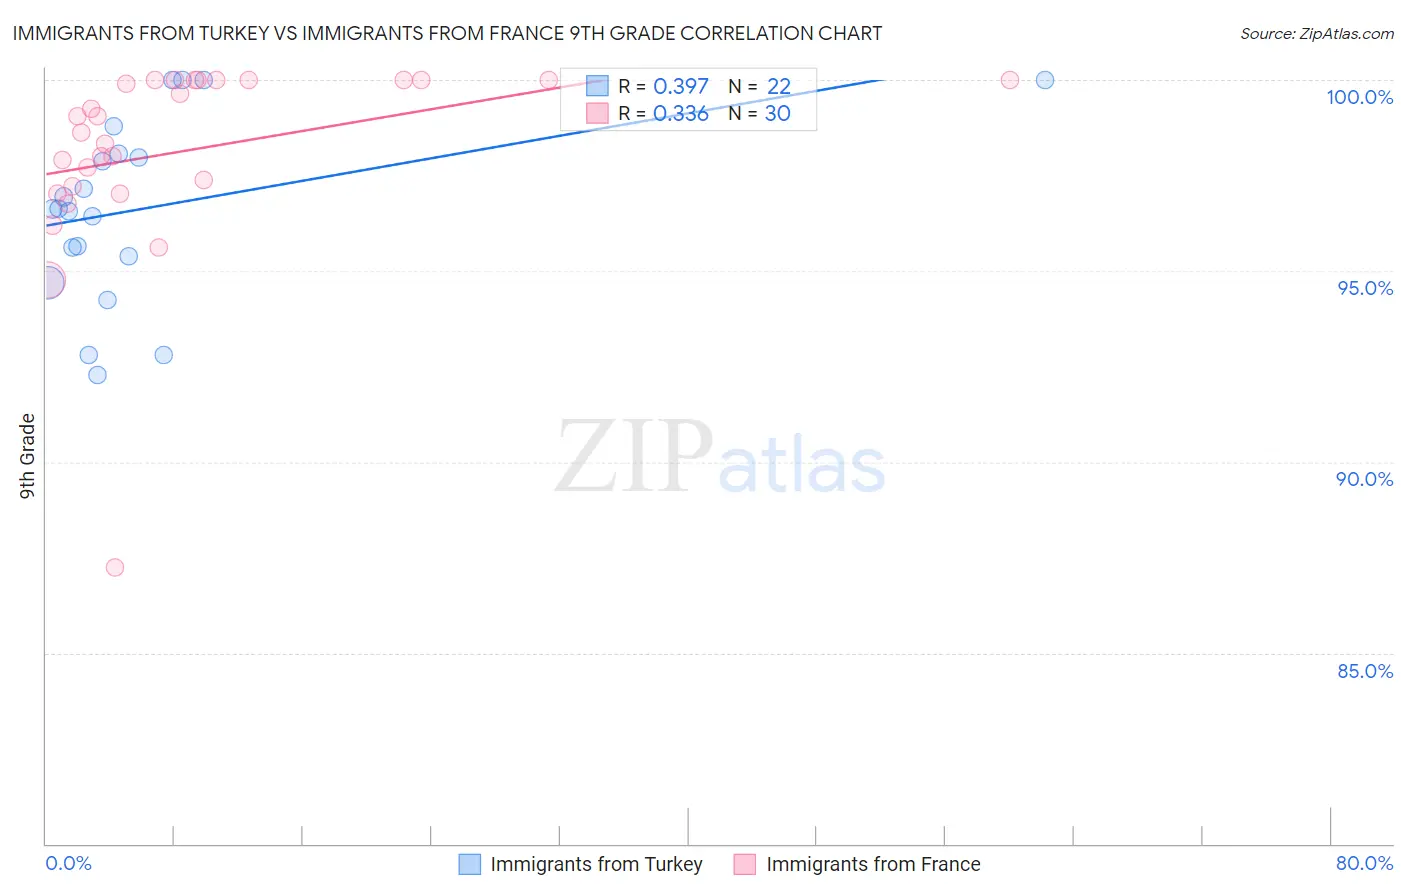
Immigrants from Turkey vs Immigrants from France 9th Grade Correlation Chart
The statistical analysis conducted on geographies consisting of 223,057,877 people shows a mild positive correlation between the proportion of Immigrants from Turkey and percentage of population with at least 9th grade education in the United States with a correlation coefficient (R) of 0.397 and weighted average of 95.4%. Similarly, the statistical analysis conducted on geographies consisting of 287,920,814 people shows a mild positive correlation between the proportion of Immigrants from France and percentage of population with at least 9th grade education in the United States with a correlation coefficient (R) of 0.336 and weighted average of 95.5%, a difference of 0.10%.
9th Grade Correlation Summary
| Measurement | Immigrants from Turkey | Immigrants from France |
| Minimum | 92.3% | 87.2% |
| Maximum | 100.0% | 100.0% |
| Range | 7.7% | 12.8% |
| Mean | 96.7% | 98.2% |
| Median | 96.6% | 98.8% |
| Interquartile 25% (IQ1) | 95.4% | 97.2% |
| Interquartile 75% (IQ3) | 98.1% | 100.0% |
| Interquartile Range (IQR) | 2.7% | 2.8% |
| Standard Deviation (Sample) | 2.4% | 2.6% |
| Standard Deviation (Population) | 2.3% | 2.5% |
Demographics Similar to Immigrants from Turkey and Immigrants from France by 9th Grade
In terms of 9th grade, the demographic groups most similar to Immigrants from Turkey are Immigrants from Europe (95.4%, a difference of 0.0%), Immigrants from Romania (95.4%, a difference of 0.0%), Soviet Union (95.4%, a difference of 0.0%), Cambodian (95.4%, a difference of 0.0%), and Cree (95.4%, a difference of 0.0%). Similarly, the demographic groups most similar to Immigrants from France are Syrian (95.5%, a difference of 0.0%), Immigrants from Norway (95.5%, a difference of 0.010%), Potawatomi (95.5%, a difference of 0.020%), Immigrants from Switzerland (95.5%, a difference of 0.030%), and Immigrants from Zimbabwe (95.5%, a difference of 0.030%).
| Demographics | Rating | Rank | 9th Grade |
| Immigrants | Moldova | 97.9 /100 | #101 | Exceptional 95.5% |
| Immigrants | Switzerland | 97.7 /100 | #102 | Exceptional 95.5% |
| Potawatomi | 97.7 /100 | #103 | Exceptional 95.5% |
| Syrians | 97.4 /100 | #104 | Exceptional 95.5% |
| Immigrants | France | 97.4 /100 | #105 | Exceptional 95.5% |
| Immigrants | Norway | 97.1 /100 | #106 | Exceptional 95.5% |
| Immigrants | Zimbabwe | 96.9 /100 | #107 | Exceptional 95.5% |
| Chickasaw | 96.8 /100 | #108 | Exceptional 95.5% |
| Osage | 96.8 /100 | #109 | Exceptional 95.5% |
| Immigrants | Bulgaria | 96.7 /100 | #110 | Exceptional 95.5% |
| Cherokee | 96.3 /100 | #111 | Exceptional 95.4% |
| Immigrants | Croatia | 96.2 /100 | #112 | Exceptional 95.4% |
| Iroquois | 96.2 /100 | #113 | Exceptional 95.4% |
| German Russians | 96.1 /100 | #114 | Exceptional 95.4% |
| Burmese | 96.0 /100 | #115 | Exceptional 95.4% |
| Immigrants | Europe | 95.7 /100 | #116 | Exceptional 95.4% |
| Immigrants | Romania | 95.6 /100 | #117 | Exceptional 95.4% |
| Immigrants | Turkey | 95.6 /100 | #118 | Exceptional 95.4% |
| Soviet Union | 95.6 /100 | #119 | Exceptional 95.4% |
| Cambodians | 95.6 /100 | #120 | Exceptional 95.4% |
| Cree | 95.5 /100 | #121 | Exceptional 95.4% |