Immigrants from Trinidad and Tobago vs Belgian Disability Age 5 to 17
COMPARE
Immigrants from Trinidad and Tobago
Belgian
Disability Age 5 to 17
Disability Age 5 to 17 Comparison
Immigrants from Trinidad and Tobago
Belgians
5.6%
DISABILITY AGE 5 TO 17
47.6/ 100
METRIC RATING
178th/ 347
METRIC RANK
5.8%
DISABILITY AGE 5 TO 17
6.9/ 100
METRIC RATING
220th/ 347
METRIC RANK
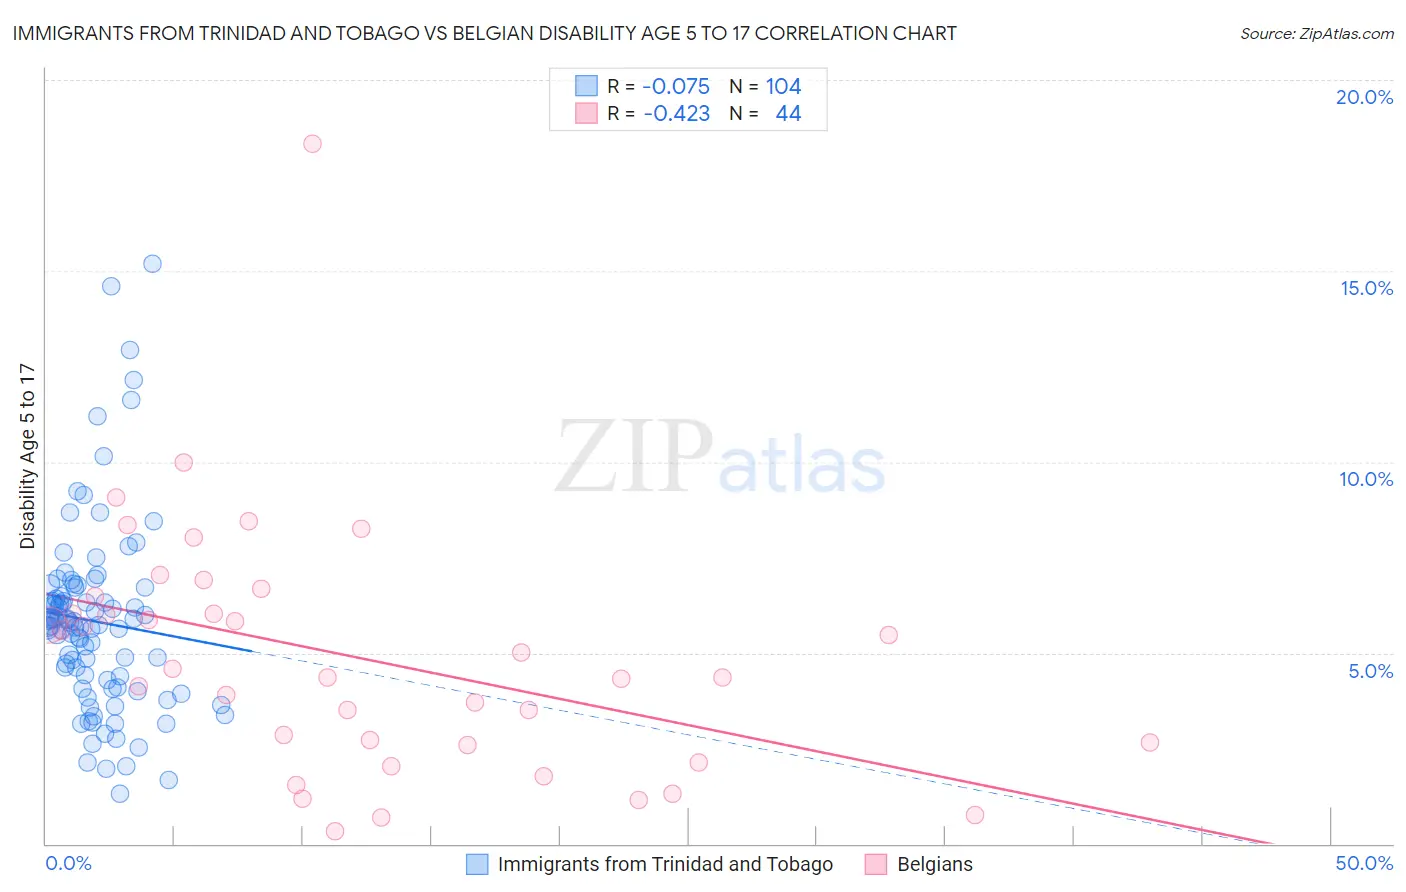
Immigrants from Trinidad and Tobago vs Belgian Disability Age 5 to 17 Correlation Chart
The statistical analysis conducted on geographies consisting of 222,636,548 people shows a slight negative correlation between the proportion of Immigrants from Trinidad and Tobago and percentage of population with a disability between the ages 5 and 17 in the United States with a correlation coefficient (R) of -0.075 and weighted average of 5.6%. Similarly, the statistical analysis conducted on geographies consisting of 352,796,896 people shows a moderate negative correlation between the proportion of Belgians and percentage of population with a disability between the ages 5 and 17 in the United States with a correlation coefficient (R) of -0.423 and weighted average of 5.8%, a difference of 3.1%.
Disability Age 5 to 17 Correlation Summary
| Measurement | Immigrants from Trinidad and Tobago | Belgian |
| Minimum | 1.3% | 0.33% |
| Maximum | 15.2% | 18.3% |
| Range | 13.9% | 18.0% |
| Mean | 5.8% | 4.9% |
| Median | 5.8% | 4.5% |
| Interquartile 25% (IQ1) | 4.2% | 2.6% |
| Interquartile 75% (IQ3) | 6.6% | 6.3% |
| Interquartile Range (IQR) | 2.4% | 3.6% |
| Standard Deviation (Sample) | 2.5% | 3.2% |
| Standard Deviation (Population) | 2.5% | 3.2% |
Similar Demographics by Disability Age 5 to 17
Demographics Similar to Immigrants from Trinidad and Tobago by Disability Age 5 to 17
In terms of disability age 5 to 17, the demographic groups most similar to Immigrants from Trinidad and Tobago are Immigrants from Western Europe (5.6%, a difference of 0.010%), Shoshone (5.6%, a difference of 0.090%), Immigrants from Central America (5.6%, a difference of 0.090%), Costa Rican (5.6%, a difference of 0.12%), and Uruguayan (5.6%, a difference of 0.17%).
| Demographics | Rating | Rank | Disability Age 5 to 17 |
| Immigrants | Iraq | 53.9 /100 | #171 | Average 5.6% |
| Ukrainians | 51.5 /100 | #172 | Average 5.6% |
| Uruguayans | 51.0 /100 | #173 | Average 5.6% |
| Costa Ricans | 50.0 /100 | #174 | Average 5.6% |
| Shoshone | 49.4 /100 | #175 | Average 5.6% |
| Immigrants | Central America | 49.4 /100 | #176 | Average 5.6% |
| Immigrants | Western Europe | 47.8 /100 | #177 | Average 5.6% |
| Immigrants | Trinidad and Tobago | 47.6 /100 | #178 | Average 5.6% |
| Immigrants | Barbados | 40.5 /100 | #179 | Average 5.6% |
| Immigrants | Uruguay | 37.7 /100 | #180 | Fair 5.6% |
| Immigrants | England | 36.4 /100 | #181 | Fair 5.6% |
| Mexican American Indians | 35.2 /100 | #182 | Fair 5.6% |
| Immigrants | Latin America | 34.3 /100 | #183 | Fair 5.6% |
| Syrians | 33.8 /100 | #184 | Fair 5.6% |
| Immigrants | Mexico | 33.7 /100 | #185 | Fair 5.6% |
Demographics Similar to Belgians by Disability Age 5 to 17
In terms of disability age 5 to 17, the demographic groups most similar to Belgians are Sierra Leonean (5.8%, a difference of 0.010%), Immigrants from Sierra Leone (5.8%, a difference of 0.030%), Lithuanian (5.8%, a difference of 0.040%), Immigrants from Sudan (5.8%, a difference of 0.040%), and Czech (5.8%, a difference of 0.080%).
| Demographics | Rating | Rank | Disability Age 5 to 17 |
| Immigrants | Cameroon | 8.3 /100 | #213 | Tragic 5.8% |
| Immigrants | Morocco | 8.3 /100 | #214 | Tragic 5.8% |
| Swedes | 8.1 /100 | #215 | Tragic 5.8% |
| Nigerians | 7.5 /100 | #216 | Tragic 5.8% |
| Czechs | 7.4 /100 | #217 | Tragic 5.8% |
| Immigrants | Sierra Leone | 7.1 /100 | #218 | Tragic 5.8% |
| Sierra Leoneans | 7.0 /100 | #219 | Tragic 5.8% |
| Belgians | 6.9 /100 | #220 | Tragic 5.8% |
| Lithuanians | 6.7 /100 | #221 | Tragic 5.8% |
| Immigrants | Sudan | 6.7 /100 | #222 | Tragic 5.8% |
| Alsatians | 6.0 /100 | #223 | Tragic 5.8% |
| Mexicans | 5.7 /100 | #224 | Tragic 5.8% |
| Guamanians/Chamorros | 5.6 /100 | #225 | Tragic 5.8% |
| British West Indians | 5.4 /100 | #226 | Tragic 5.8% |
| Swiss | 5.1 /100 | #227 | Tragic 5.8% |