Arab vs Okinawan Disability Age 5 to 17
COMPARE
Arab
Okinawan
Disability Age 5 to 17
Disability Age 5 to 17 Comparison
Arabs
Okinawans
5.4%
DISABILITY AGE 5 TO 17
92.9/ 100
METRIC RATING
131st/ 347
METRIC RANK
5.0%
DISABILITY AGE 5 TO 17
100.0/ 100
METRIC RATING
40th/ 347
METRIC RANK
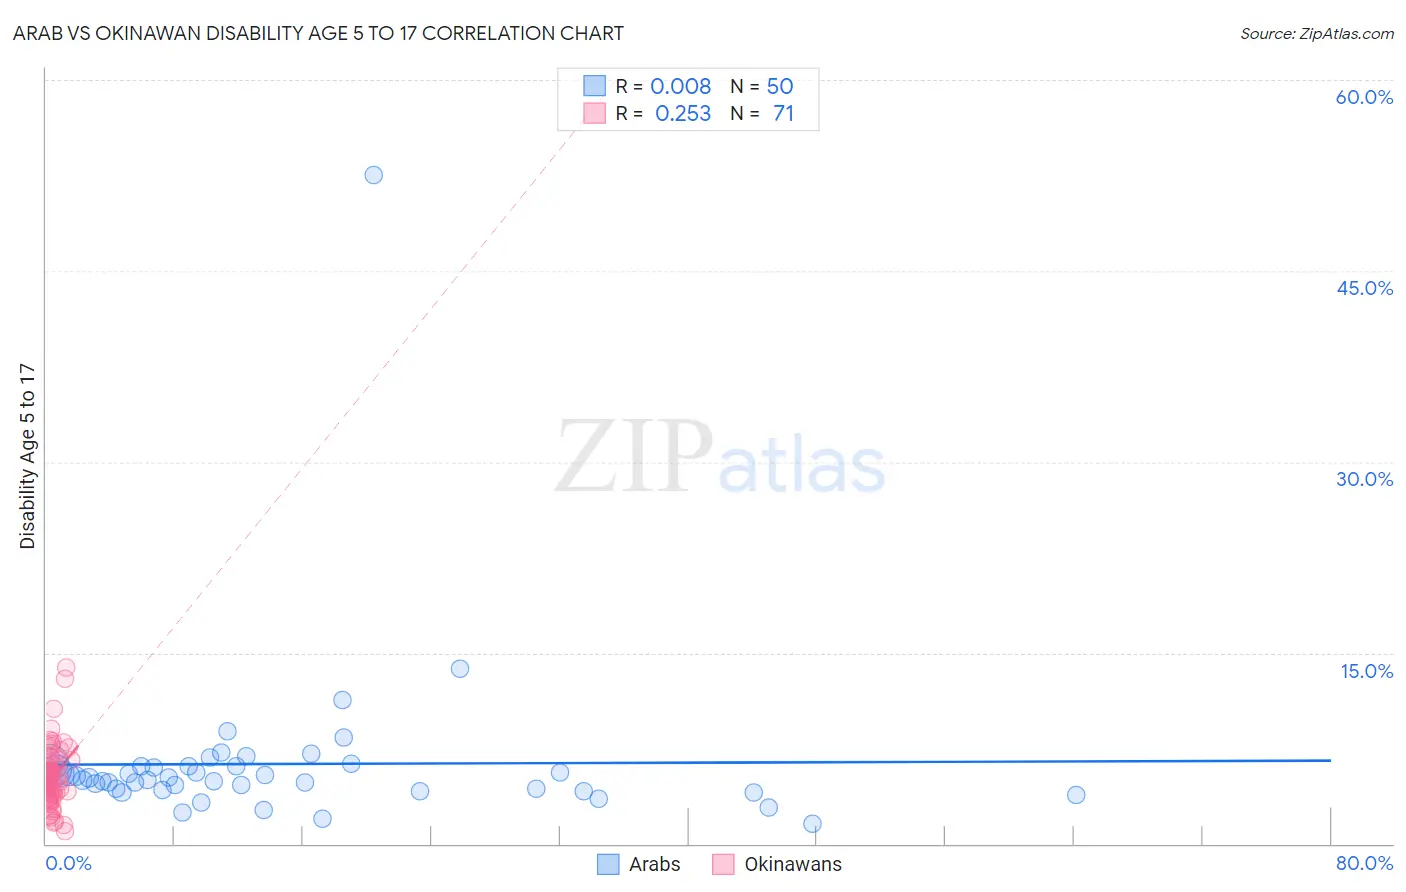
Arab vs Okinawan Disability Age 5 to 17 Correlation Chart
The statistical analysis conducted on geographies consisting of 481,041,182 people shows no correlation between the proportion of Arabs and percentage of population with a disability between the ages 5 and 17 in the United States with a correlation coefficient (R) of 0.008 and weighted average of 5.4%. Similarly, the statistical analysis conducted on geographies consisting of 73,585,145 people shows a weak positive correlation between the proportion of Okinawans and percentage of population with a disability between the ages 5 and 17 in the United States with a correlation coefficient (R) of 0.253 and weighted average of 5.0%, a difference of 8.1%.
Disability Age 5 to 17 Correlation Summary
| Measurement | Arab | Okinawan |
| Minimum | 1.6% | 1.0% |
| Maximum | 52.5% | 13.9% |
| Range | 50.9% | 12.8% |
| Mean | 6.3% | 5.2% |
| Median | 5.1% | 4.9% |
| Interquartile 25% (IQ1) | 4.2% | 3.9% |
| Interquartile 75% (IQ3) | 6.1% | 6.1% |
| Interquartile Range (IQR) | 1.9% | 2.2% |
| Standard Deviation (Sample) | 7.0% | 2.3% |
| Standard Deviation (Population) | 6.9% | 2.3% |
Similar Demographics by Disability Age 5 to 17
Demographics Similar to Arabs by Disability Age 5 to 17
In terms of disability age 5 to 17, the demographic groups most similar to Arabs are Immigrants from Colombia (5.4%, a difference of 0.020%), Venezuelan (5.4%, a difference of 0.050%), Yuman (5.4%, a difference of 0.13%), Immigrants from Belize (5.4%, a difference of 0.22%), and Immigrants from Bulgaria (5.4%, a difference of 0.23%).
| Demographics | Rating | Rank | Disability Age 5 to 17 |
| Crow | 95.0 /100 | #124 | Exceptional 5.4% |
| Immigrants | Chile | 95.0 /100 | #125 | Exceptional 5.4% |
| New Zealanders | 95.0 /100 | #126 | Exceptional 5.4% |
| Latvians | 95.0 /100 | #127 | Exceptional 5.4% |
| Immigrants | Venezuela | 94.5 /100 | #128 | Exceptional 5.4% |
| Romanians | 94.1 /100 | #129 | Exceptional 5.4% |
| Immigrants | Bulgaria | 94.0 /100 | #130 | Exceptional 5.4% |
| Arabs | 92.9 /100 | #131 | Exceptional 5.4% |
| Immigrants | Colombia | 92.9 /100 | #132 | Exceptional 5.4% |
| Venezuelans | 92.7 /100 | #133 | Exceptional 5.4% |
| Yuman | 92.3 /100 | #134 | Exceptional 5.4% |
| Immigrants | Belize | 91.7 /100 | #135 | Exceptional 5.4% |
| Immigrants | Denmark | 91.4 /100 | #136 | Exceptional 5.4% |
| Navajo | 90.9 /100 | #137 | Exceptional 5.4% |
| Immigrants | Oceania | 90.8 /100 | #138 | Exceptional 5.4% |
Demographics Similar to Okinawans by Disability Age 5 to 17
In terms of disability age 5 to 17, the demographic groups most similar to Okinawans are Immigrants from Argentina (5.0%, a difference of 0.080%), Immigrants from Australia (5.0%, a difference of 0.080%), Immigrants from Philippines (5.0%, a difference of 0.090%), Immigrants from Sri Lanka (5.0%, a difference of 0.090%), and Immigrants from Belarus (5.0%, a difference of 0.13%).
| Demographics | Rating | Rank | Disability Age 5 to 17 |
| Immigrants | Indonesia | 100.0 /100 | #33 | Exceptional 5.0% |
| Israelis | 100.0 /100 | #34 | Exceptional 5.0% |
| Bolivians | 100.0 /100 | #35 | Exceptional 5.0% |
| Immigrants | Egypt | 100.0 /100 | #36 | Exceptional 5.0% |
| Immigrants | Belarus | 100.0 /100 | #37 | Exceptional 5.0% |
| Immigrants | Philippines | 100.0 /100 | #38 | Exceptional 5.0% |
| Immigrants | Argentina | 100.0 /100 | #39 | Exceptional 5.0% |
| Okinawans | 100.0 /100 | #40 | Exceptional 5.0% |
| Immigrants | Australia | 100.0 /100 | #41 | Exceptional 5.0% |
| Immigrants | Sri Lanka | 100.0 /100 | #42 | Exceptional 5.0% |
| Immigrants | Russia | 100.0 /100 | #43 | Exceptional 5.0% |
| Egyptians | 100.0 /100 | #44 | Exceptional 5.0% |
| Tongans | 100.0 /100 | #45 | Exceptional 5.0% |
| Assyrians/Chaldeans/Syriacs | 100.0 /100 | #46 | Exceptional 5.0% |
| Vietnamese | 100.0 /100 | #47 | Exceptional 5.1% |