Immigrants from Syria vs Okinawan 8th Grade
COMPARE
Immigrants from Syria
Okinawan
8th Grade
8th Grade Comparison
Immigrants from Syria
Okinawans
95.3%
8TH GRADE
7.4/ 100
METRIC RATING
221st/ 347
METRIC RANK
96.3%
8TH GRADE
98.0/ 100
METRIC RATING
106th/ 347
METRIC RANK
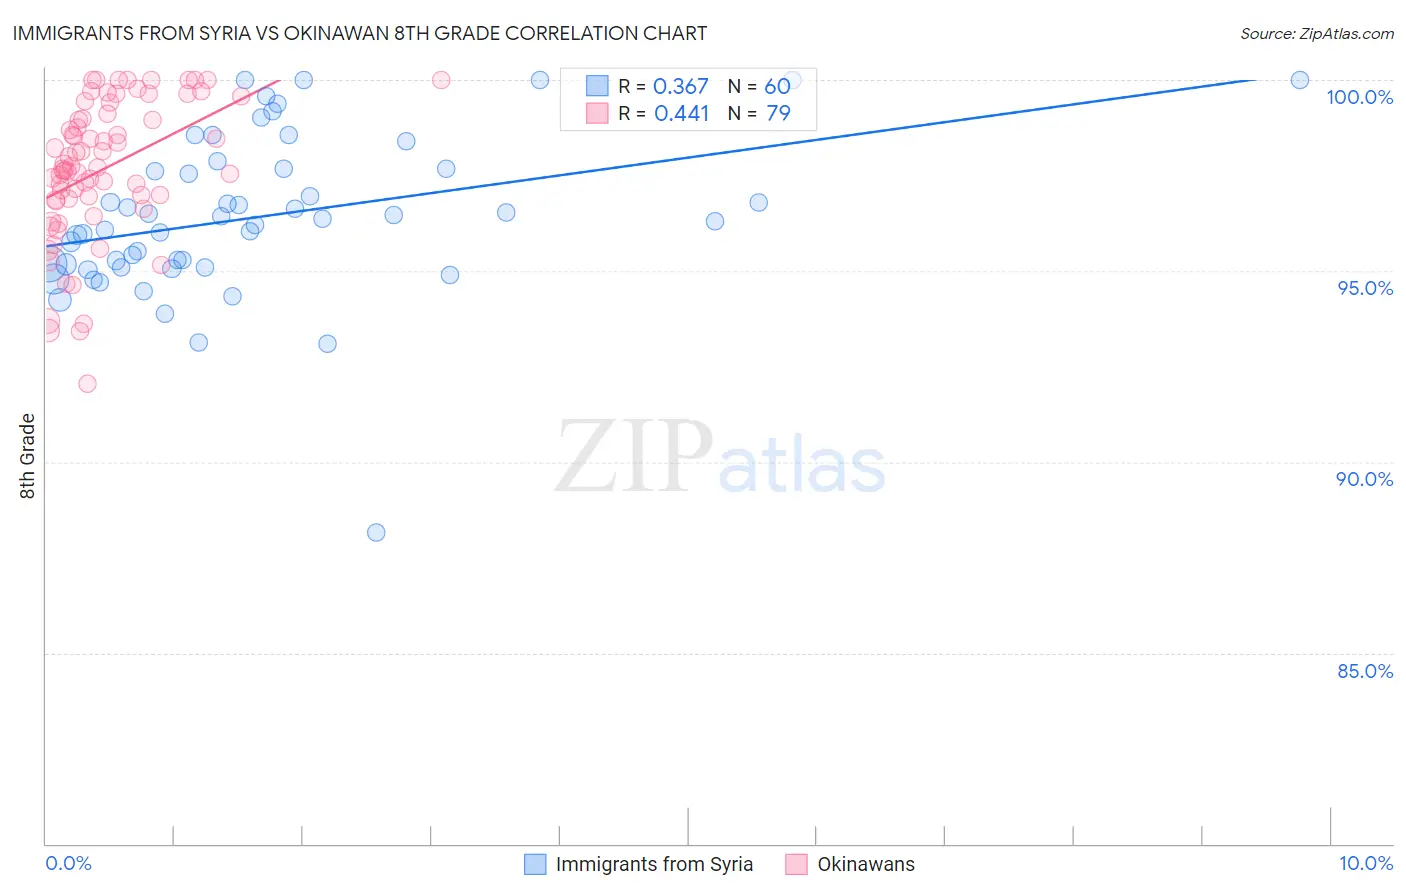
Immigrants from Syria vs Okinawan 8th Grade Correlation Chart
The statistical analysis conducted on geographies consisting of 174,108,374 people shows a mild positive correlation between the proportion of Immigrants from Syria and percentage of population with at least 8th grade education in the United States with a correlation coefficient (R) of 0.367 and weighted average of 95.3%. Similarly, the statistical analysis conducted on geographies consisting of 73,779,368 people shows a moderate positive correlation between the proportion of Okinawans and percentage of population with at least 8th grade education in the United States with a correlation coefficient (R) of 0.441 and weighted average of 96.3%, a difference of 1.0%.
8th Grade Correlation Summary
| Measurement | Immigrants from Syria | Okinawan |
| Minimum | 88.1% | 92.0% |
| Maximum | 100.0% | 100.0% |
| Range | 11.9% | 8.0% |
| Mean | 96.4% | 97.7% |
| Median | 96.3% | 97.7% |
| Interquartile 25% (IQ1) | 95.1% | 96.9% |
| Interquartile 75% (IQ3) | 97.7% | 99.1% |
| Interquartile Range (IQR) | 2.5% | 2.2% |
| Standard Deviation (Sample) | 2.1% | 1.8% |
| Standard Deviation (Population) | 2.1% | 1.8% |
Similar Demographics by 8th Grade
Demographics Similar to Immigrants from Syria by 8th Grade
In terms of 8th grade, the demographic groups most similar to Immigrants from Syria are Immigrants from Malaysia (95.3%, a difference of 0.0%), Dutch West Indian (95.4%, a difference of 0.010%), Spanish American (95.4%, a difference of 0.010%), Immigrants from Southern Europe (95.3%, a difference of 0.010%), and Immigrants from Oceania (95.3%, a difference of 0.010%).
| Demographics | Rating | Rank | 8th Grade |
| Immigrants | Chile | 9.0 /100 | #214 | Tragic 95.4% |
| Immigrants | Liberia | 8.9 /100 | #215 | Tragic 95.4% |
| Samoans | 8.4 /100 | #216 | Tragic 95.4% |
| Immigrants | Eastern Asia | 8.3 /100 | #217 | Tragic 95.4% |
| Dutch West Indians | 8.1 /100 | #218 | Tragic 95.4% |
| Spanish Americans | 8.0 /100 | #219 | Tragic 95.4% |
| Immigrants | Southern Europe | 7.7 /100 | #220 | Tragic 95.3% |
| Immigrants | Syria | 7.4 /100 | #221 | Tragic 95.3% |
| Immigrants | Malaysia | 7.3 /100 | #222 | Tragic 95.3% |
| Immigrants | Oceania | 7.1 /100 | #223 | Tragic 95.3% |
| Immigrants | Western Asia | 6.0 /100 | #224 | Tragic 95.3% |
| Sub-Saharan Africans | 6.0 /100 | #225 | Tragic 95.3% |
| Navajo | 5.7 /100 | #226 | Tragic 95.3% |
| Bahamians | 5.6 /100 | #227 | Tragic 95.3% |
| Immigrants | Eastern Africa | 5.6 /100 | #228 | Tragic 95.3% |
Demographics Similar to Okinawans by 8th Grade
In terms of 8th grade, the demographic groups most similar to Okinawans are Immigrants from Saudi Arabia (96.3%, a difference of 0.0%), Kiowa (96.3%, a difference of 0.0%), Immigrants from North Macedonia (96.3%, a difference of 0.0%), Immigrants from Latvia (96.3%, a difference of 0.010%), and Bhutanese (96.4%, a difference of 0.020%).
| Demographics | Rating | Rank | 8th Grade |
| Cree | 98.6 /100 | #99 | Exceptional 96.4% |
| Immigrants | Czechoslovakia | 98.6 /100 | #100 | Exceptional 96.4% |
| Bhutanese | 98.2 /100 | #101 | Exceptional 96.4% |
| South Africans | 98.2 /100 | #102 | Exceptional 96.4% |
| Immigrants | Saudi Arabia | 98.0 /100 | #103 | Exceptional 96.3% |
| Kiowa | 98.0 /100 | #104 | Exceptional 96.3% |
| Immigrants | North Macedonia | 98.0 /100 | #105 | Exceptional 96.3% |
| Okinawans | 98.0 /100 | #106 | Exceptional 96.3% |
| Immigrants | Latvia | 97.8 /100 | #107 | Exceptional 96.3% |
| Lebanese | 97.5 /100 | #108 | Exceptional 96.3% |
| Iroquois | 97.5 /100 | #109 | Exceptional 96.3% |
| Cajuns | 97.1 /100 | #110 | Exceptional 96.3% |
| Shoshone | 96.8 /100 | #111 | Exceptional 96.3% |
| Syrians | 96.7 /100 | #112 | Exceptional 96.3% |
| Immigrants | Zimbabwe | 96.7 /100 | #113 | Exceptional 96.3% |