Immigrants from Syria vs Okinawan Median Female Earnings
COMPARE
Immigrants from Syria
Okinawan
Median Female Earnings
Median Female Earnings Comparison
Immigrants from Syria
Okinawans
$40,499
MEDIAN FEMALE EARNINGS
84.1/ 100
METRIC RATING
141st/ 347
METRIC RANK
$46,905
MEDIAN FEMALE EARNINGS
100.0/ 100
METRIC RATING
11th/ 347
METRIC RANK
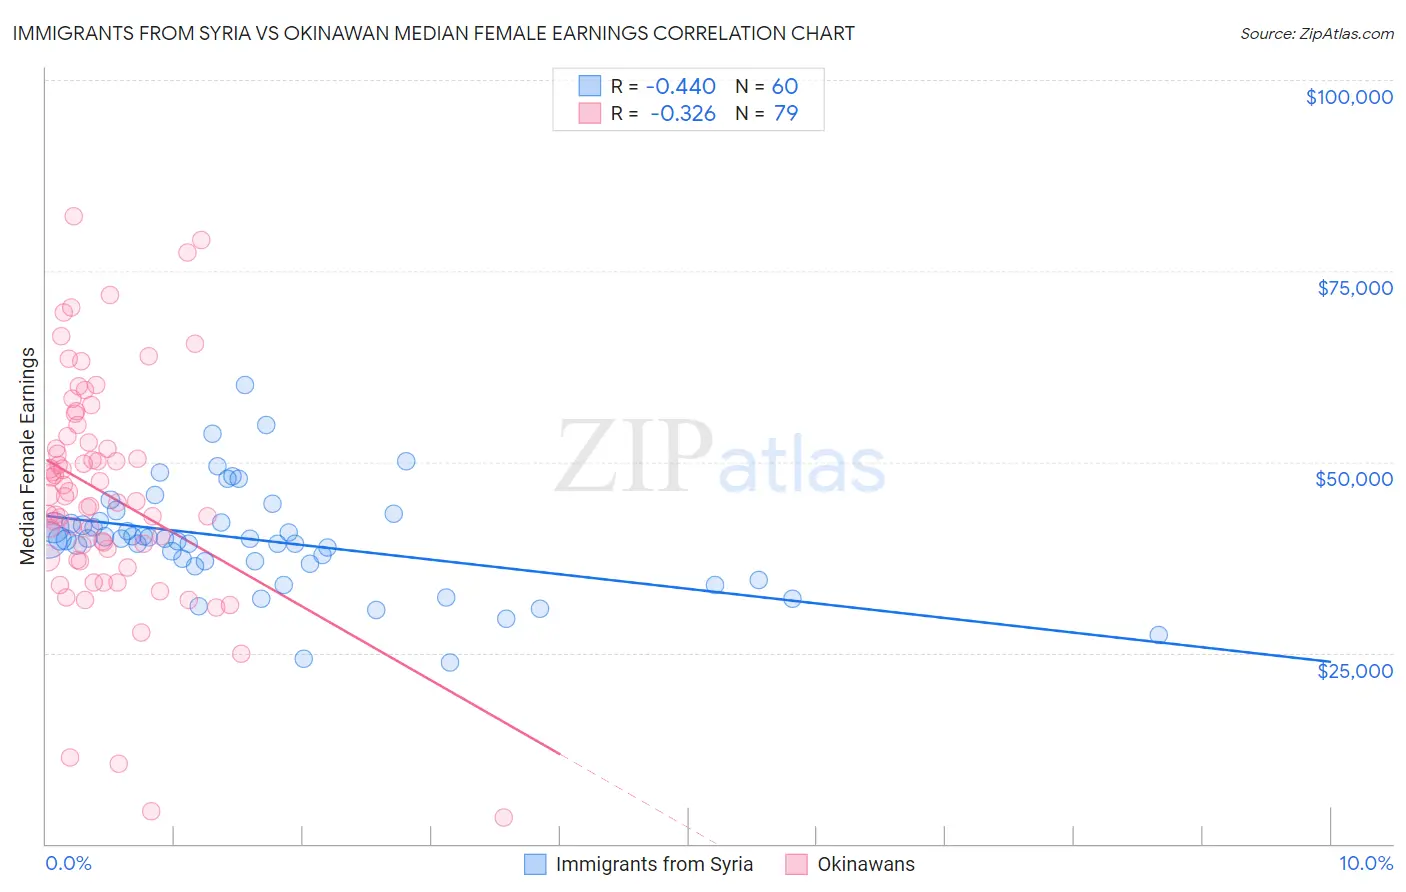
Immigrants from Syria vs Okinawan Median Female Earnings Correlation Chart
The statistical analysis conducted on geographies consisting of 174,108,598 people shows a moderate negative correlation between the proportion of Immigrants from Syria and median female earnings in the United States with a correlation coefficient (R) of -0.440 and weighted average of $40,499. Similarly, the statistical analysis conducted on geographies consisting of 73,768,559 people shows a mild negative correlation between the proportion of Okinawans and median female earnings in the United States with a correlation coefficient (R) of -0.326 and weighted average of $46,905, a difference of 15.8%.
Median Female Earnings Correlation Summary
| Measurement | Immigrants from Syria | Okinawan |
| Minimum | $23,750 | $3,494 |
| Maximum | $60,000 | $82,101 |
| Range | $36,250 | $78,607 |
| Mean | $39,767 | $45,866 |
| Median | $39,904 | $45,553 |
| Interquartile 25% (IQ1) | $36,881 | $37,429 |
| Interquartile 75% (IQ3) | $42,187 | $53,420 |
| Interquartile Range (IQR) | $5,305 | $15,991 |
| Standard Deviation (Sample) | $6,836 | $15,052 |
| Standard Deviation (Population) | $6,779 | $14,956 |
Similar Demographics by Median Female Earnings
Demographics Similar to Immigrants from Syria by Median Female Earnings
In terms of median female earnings, the demographic groups most similar to Immigrants from Syria are Sri Lankan ($40,496, a difference of 0.010%), Northern European ($40,491, a difference of 0.020%), Immigrants from North Macedonia ($40,488, a difference of 0.030%), Brazilian ($40,483, a difference of 0.040%), and Serbian ($40,539, a difference of 0.10%).
| Demographics | Rating | Rank | Median Female Earnings |
| Arabs | 89.3 /100 | #134 | Excellent $40,718 |
| Immigrants | Nepal | 89.0 /100 | #135 | Excellent $40,704 |
| Immigrants | Eastern Africa | 87.7 /100 | #136 | Excellent $40,644 |
| Pakistanis | 86.6 /100 | #137 | Excellent $40,596 |
| Taiwanese | 86.1 /100 | #138 | Excellent $40,576 |
| Immigrants | South Eastern Asia | 85.7 /100 | #139 | Excellent $40,558 |
| Serbians | 85.2 /100 | #140 | Excellent $40,539 |
| Immigrants | Syria | 84.1 /100 | #141 | Excellent $40,499 |
| Sri Lankans | 84.0 /100 | #142 | Excellent $40,496 |
| Northern Europeans | 83.9 /100 | #143 | Excellent $40,491 |
| Immigrants | North Macedonia | 83.8 /100 | #144 | Excellent $40,488 |
| Brazilians | 83.6 /100 | #145 | Excellent $40,483 |
| Ghanaians | 82.1 /100 | #146 | Excellent $40,429 |
| Vietnamese | 80.4 /100 | #147 | Excellent $40,377 |
| Poles | 80.2 /100 | #148 | Excellent $40,371 |
Demographics Similar to Okinawans by Median Female Earnings
In terms of median female earnings, the demographic groups most similar to Okinawans are Immigrants from Israel ($46,902, a difference of 0.010%), Immigrants from China ($46,972, a difference of 0.14%), Immigrants from Iran ($47,154, a difference of 0.53%), Immigrants from Australia ($46,573, a difference of 0.71%), and Soviet Union ($46,556, a difference of 0.75%).
| Demographics | Rating | Rank | Median Female Earnings |
| Immigrants | India | 100.0 /100 | #4 | Exceptional $48,292 |
| Immigrants | Singapore | 100.0 /100 | #5 | Exceptional $47,986 |
| Immigrants | Ireland | 100.0 /100 | #6 | Exceptional $47,598 |
| Thais | 100.0 /100 | #7 | Exceptional $47,577 |
| Iranians | 100.0 /100 | #8 | Exceptional $47,421 |
| Immigrants | Iran | 100.0 /100 | #9 | Exceptional $47,154 |
| Immigrants | China | 100.0 /100 | #10 | Exceptional $46,972 |
| Okinawans | 100.0 /100 | #11 | Exceptional $46,905 |
| Immigrants | Israel | 100.0 /100 | #12 | Exceptional $46,902 |
| Immigrants | Australia | 100.0 /100 | #13 | Exceptional $46,573 |
| Soviet Union | 100.0 /100 | #14 | Exceptional $46,556 |
| Immigrants | Eastern Asia | 100.0 /100 | #15 | Exceptional $46,502 |
| Indians (Asian) | 100.0 /100 | #16 | Exceptional $46,481 |
| Immigrants | South Central Asia | 100.0 /100 | #17 | Exceptional $46,324 |
| Cypriots | 100.0 /100 | #18 | Exceptional $45,570 |