Immigrants from Switzerland vs Immigrants from Norway No Vehicles in Household
COMPARE
Immigrants from Switzerland
Immigrants from Norway
No Vehicles in Household
No Vehicles in Household Comparison
Immigrants from Switzerland
Immigrants from Norway
12.3%
NO VEHICLES IN HOUSEHOLD
0.5/ 100
METRIC RATING
264th/ 347
METRIC RANK
11.4%
NO VEHICLES IN HOUSEHOLD
5.1/ 100
METRIC RATING
230th/ 347
METRIC RANK
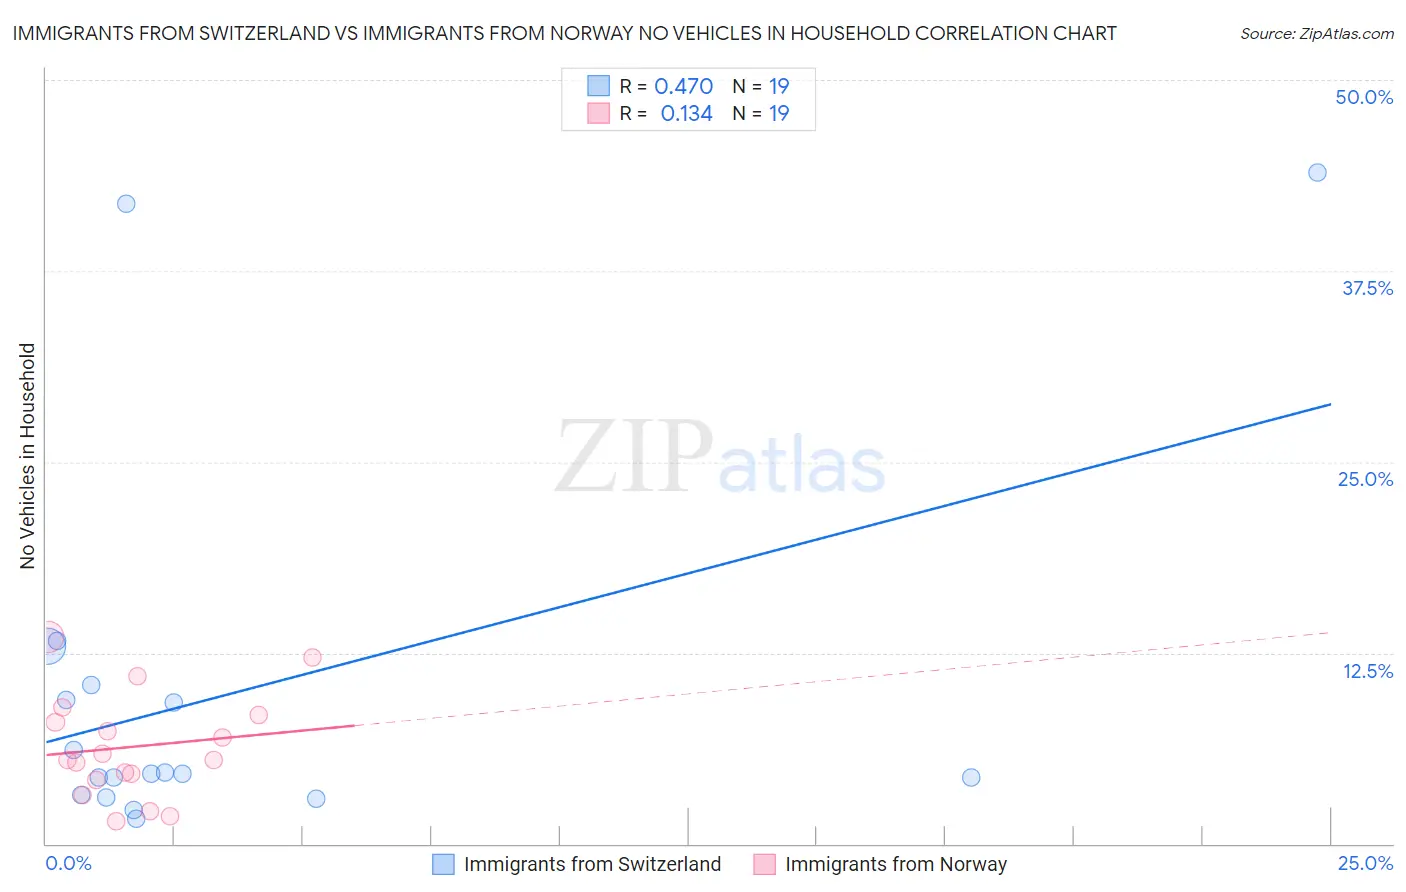
Immigrants from Switzerland vs Immigrants from Norway No Vehicles in Household Correlation Chart
The statistical analysis conducted on geographies consisting of 147,956,430 people shows a moderate positive correlation between the proportion of Immigrants from Switzerland and percentage of households with no vehicle available in the United States with a correlation coefficient (R) of 0.470 and weighted average of 12.3%. Similarly, the statistical analysis conducted on geographies consisting of 116,532,491 people shows a poor positive correlation between the proportion of Immigrants from Norway and percentage of households with no vehicle available in the United States with a correlation coefficient (R) of 0.134 and weighted average of 11.4%, a difference of 7.5%.
No Vehicles in Household Correlation Summary
| Measurement | Immigrants from Switzerland | Immigrants from Norway |
| Minimum | 1.6% | 1.5% |
| Maximum | 43.9% | 13.5% |
| Range | 42.3% | 12.1% |
| Mean | 9.9% | 6.4% |
| Median | 4.6% | 5.5% |
| Interquartile 25% (IQ1) | 3.2% | 4.2% |
| Interquartile 75% (IQ3) | 10.4% | 8.4% |
| Interquartile Range (IQR) | 7.3% | 4.3% |
| Standard Deviation (Sample) | 12.2% | 3.4% |
| Standard Deviation (Population) | 11.8% | 3.3% |
Similar Demographics by No Vehicles in Household
Demographics Similar to Immigrants from Switzerland by No Vehicles in Household
In terms of no vehicles in household, the demographic groups most similar to Immigrants from Switzerland are African (12.3%, a difference of 0.25%), Immigrants from Egypt (12.2%, a difference of 0.46%), Immigrants from Liberia (12.2%, a difference of 0.61%), Subsaharan African (12.2%, a difference of 0.69%), and Macedonian (12.2%, a difference of 1.1%).
| Demographics | Rating | Rank | No Vehicles in Household |
| Nigerians | 0.9 /100 | #257 | Tragic 12.1% |
| South American Indians | 0.9 /100 | #258 | Tragic 12.1% |
| Immigrants | Latvia | 0.8 /100 | #259 | Tragic 12.1% |
| Macedonians | 0.7 /100 | #260 | Tragic 12.2% |
| Sub-Saharan Africans | 0.6 /100 | #261 | Tragic 12.2% |
| Immigrants | Liberia | 0.6 /100 | #262 | Tragic 12.2% |
| Immigrants | Egypt | 0.6 /100 | #263 | Tragic 12.2% |
| Immigrants | Switzerland | 0.5 /100 | #264 | Tragic 12.3% |
| Africans | 0.4 /100 | #265 | Tragic 12.3% |
| Israelis | 0.3 /100 | #266 | Tragic 12.4% |
| Immigrants | Europe | 0.3 /100 | #267 | Tragic 12.5% |
| Immigrants | Africa | 0.2 /100 | #268 | Tragic 12.5% |
| Panamanians | 0.2 /100 | #269 | Tragic 12.5% |
| Immigrants | Northern Africa | 0.2 /100 | #270 | Tragic 12.6% |
| Immigrants | Morocco | 0.2 /100 | #271 | Tragic 12.6% |
Demographics Similar to Immigrants from Norway by No Vehicles in Household
In terms of no vehicles in household, the demographic groups most similar to Immigrants from Norway are Immigrants from Japan (11.4%, a difference of 0.0%), Ugandan (11.4%, a difference of 0.13%), Immigrants from Romania (11.4%, a difference of 0.16%), Immigrants from Turkey (11.5%, a difference of 0.19%), and Immigrants from Pakistan (11.4%, a difference of 0.21%).
| Demographics | Rating | Rank | No Vehicles in Household |
| Uruguayans | 7.7 /100 | #223 | Tragic 11.3% |
| Immigrants | Hong Kong | 7.2 /100 | #224 | Tragic 11.3% |
| Immigrants | Sierra Leone | 6.4 /100 | #225 | Tragic 11.3% |
| Immigrants | Somalia | 5.4 /100 | #226 | Tragic 11.4% |
| Immigrants | Pakistan | 5.4 /100 | #227 | Tragic 11.4% |
| Immigrants | Romania | 5.3 /100 | #228 | Tragic 11.4% |
| Ugandans | 5.3 /100 | #229 | Tragic 11.4% |
| Immigrants | Norway | 5.1 /100 | #230 | Tragic 11.4% |
| Immigrants | Japan | 5.1 /100 | #231 | Tragic 11.4% |
| Immigrants | Turkey | 4.8 /100 | #232 | Tragic 11.5% |
| Houma | 4.7 /100 | #233 | Tragic 11.5% |
| Immigrants | Peru | 4.5 /100 | #234 | Tragic 11.5% |
| Kiowa | 4.0 /100 | #235 | Tragic 11.5% |
| Cree | 3.5 /100 | #236 | Tragic 11.6% |
| Ute | 3.3 /100 | #237 | Tragic 11.6% |