Immigrants from Sri Lanka vs Brazilian Single Male Poverty
COMPARE
Immigrants from Sri Lanka
Brazilian
Single Male Poverty
Single Male Poverty Comparison
Immigrants from Sri Lanka
Brazilians
11.8%
SINGLE MALE POVERTY
99.7/ 100
METRIC RATING
62nd/ 347
METRIC RANK
11.8%
SINGLE MALE POVERTY
99.8/ 100
METRIC RATING
59th/ 347
METRIC RANK
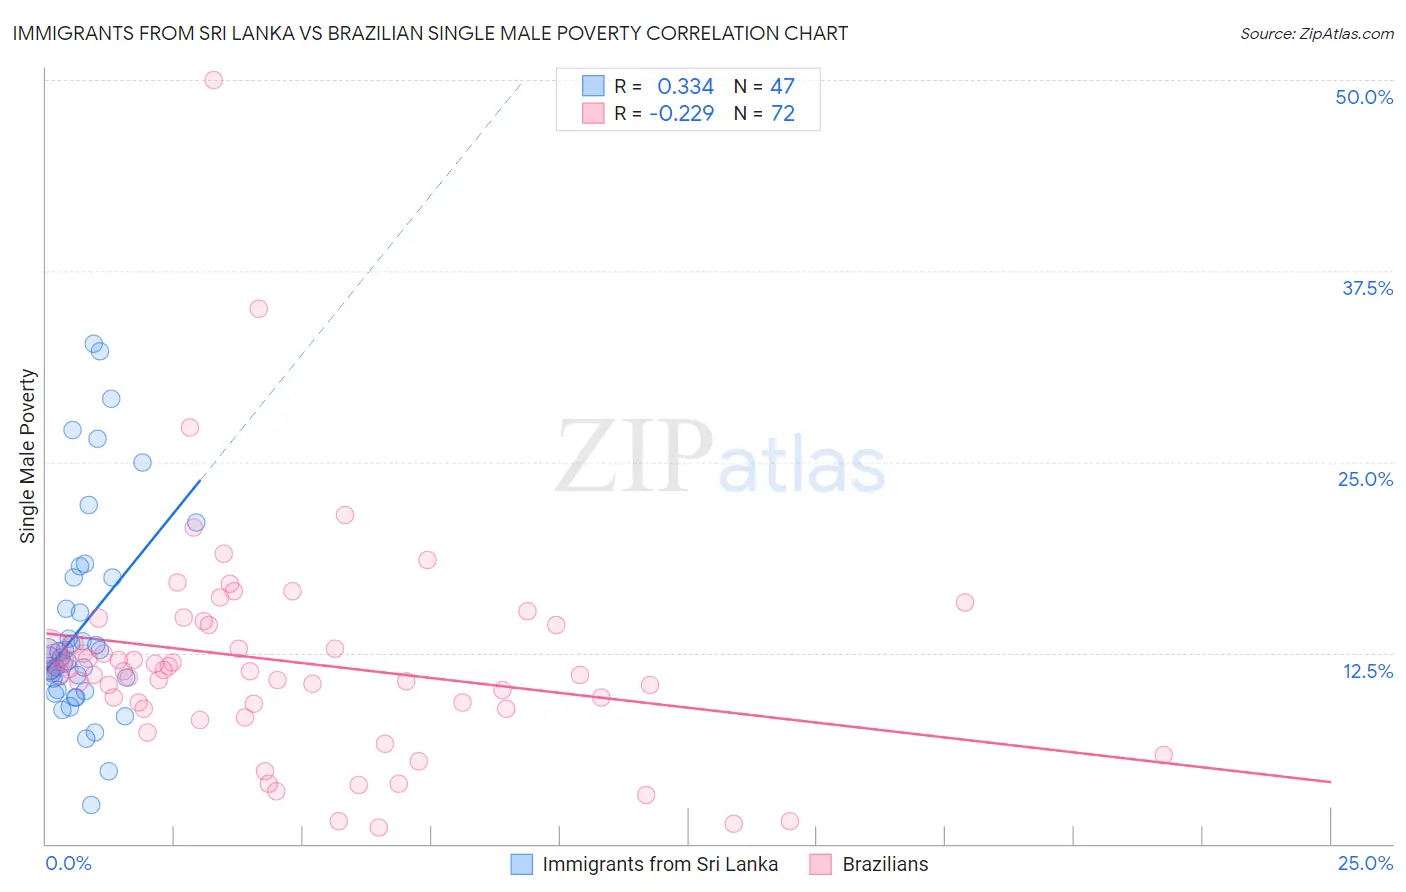
Immigrants from Sri Lanka vs Brazilian Single Male Poverty Correlation Chart
The statistical analysis conducted on geographies consisting of 139,967,113 people shows a mild positive correlation between the proportion of Immigrants from Sri Lanka and poverty level among single males in the United States with a correlation coefficient (R) of 0.334 and weighted average of 11.8%. Similarly, the statistical analysis conducted on geographies consisting of 290,096,806 people shows a weak negative correlation between the proportion of Brazilians and poverty level among single males in the United States with a correlation coefficient (R) of -0.229 and weighted average of 11.8%, a difference of 0.61%.
Single Male Poverty Correlation Summary
| Measurement | Immigrants from Sri Lanka | Brazilian |
| Minimum | 2.5% | 1.1% |
| Maximum | 32.7% | 50.0% |
| Range | 30.2% | 48.9% |
| Mean | 14.2% | 11.9% |
| Median | 12.2% | 11.3% |
| Interquartile 25% (IQ1) | 10.1% | 9.0% |
| Interquartile 75% (IQ3) | 17.4% | 14.3% |
| Interquartile Range (IQR) | 7.3% | 5.3% |
| Standard Deviation (Sample) | 6.8% | 7.3% |
| Standard Deviation (Population) | 6.7% | 7.2% |
Demographics Similar to Immigrants from Sri Lanka and Brazilians by Single Male Poverty
In terms of single male poverty, the demographic groups most similar to Immigrants from Sri Lanka are Immigrants from Belarus (11.8%, a difference of 0.050%), Immigrants from Eastern Europe (11.8%, a difference of 0.19%), Laotian (11.9%, a difference of 0.29%), Immigrants from Uruguay (11.9%, a difference of 0.29%), and Immigrants from Ukraine (11.9%, a difference of 0.30%). Similarly, the demographic groups most similar to Brazilians are Immigrants from Brazil (11.7%, a difference of 0.080%), Immigrants from Romania (11.7%, a difference of 0.11%), Peruvian (11.8%, a difference of 0.21%), Cambodian (11.8%, a difference of 0.23%), and Burmese (11.7%, a difference of 0.26%).
| Demographics | Rating | Rank | Single Male Poverty |
| Immigrants | Lithuania | 99.9 /100 | #50 | Exceptional 11.6% |
| Paraguayans | 99.9 /100 | #51 | Exceptional 11.6% |
| Samoans | 99.9 /100 | #52 | Exceptional 11.7% |
| Bulgarians | 99.9 /100 | #53 | Exceptional 11.7% |
| Immigrants | Uzbekistan | 99.9 /100 | #54 | Exceptional 11.7% |
| Cypriots | 99.9 /100 | #55 | Exceptional 11.7% |
| Burmese | 99.8 /100 | #56 | Exceptional 11.7% |
| Immigrants | Romania | 99.8 /100 | #57 | Exceptional 11.7% |
| Immigrants | Brazil | 99.8 /100 | #58 | Exceptional 11.7% |
| Brazilians | 99.8 /100 | #59 | Exceptional 11.8% |
| Peruvians | 99.8 /100 | #60 | Exceptional 11.8% |
| Cambodians | 99.8 /100 | #61 | Exceptional 11.8% |
| Immigrants | Sri Lanka | 99.7 /100 | #62 | Exceptional 11.8% |
| Immigrants | Belarus | 99.7 /100 | #63 | Exceptional 11.8% |
| Immigrants | Eastern Europe | 99.6 /100 | #64 | Exceptional 11.8% |
| Laotians | 99.6 /100 | #65 | Exceptional 11.9% |
| Immigrants | Uruguay | 99.6 /100 | #66 | Exceptional 11.9% |
| Immigrants | Ukraine | 99.6 /100 | #67 | Exceptional 11.9% |
| Immigrants | Croatia | 99.6 /100 | #68 | Exceptional 11.9% |
| Immigrants | Russia | 99.6 /100 | #69 | Exceptional 11.9% |
| Immigrants | Nepal | 99.6 /100 | #70 | Exceptional 11.9% |