Immigrants from South Central Asia vs Yugoslavian Disability Age Under 5
COMPARE
Immigrants from South Central Asia
Yugoslavian
Disability Age Under 5
Disability Age Under 5 Comparison
Immigrants from South Central Asia
Yugoslavians
1.0%
DISABILITY AGE UNDER 5
99.9/ 100
METRIC RATING
30th/ 347
METRIC RANK
1.4%
DISABILITY AGE UNDER 5
0.1/ 100
METRIC RATING
264th/ 347
METRIC RANK
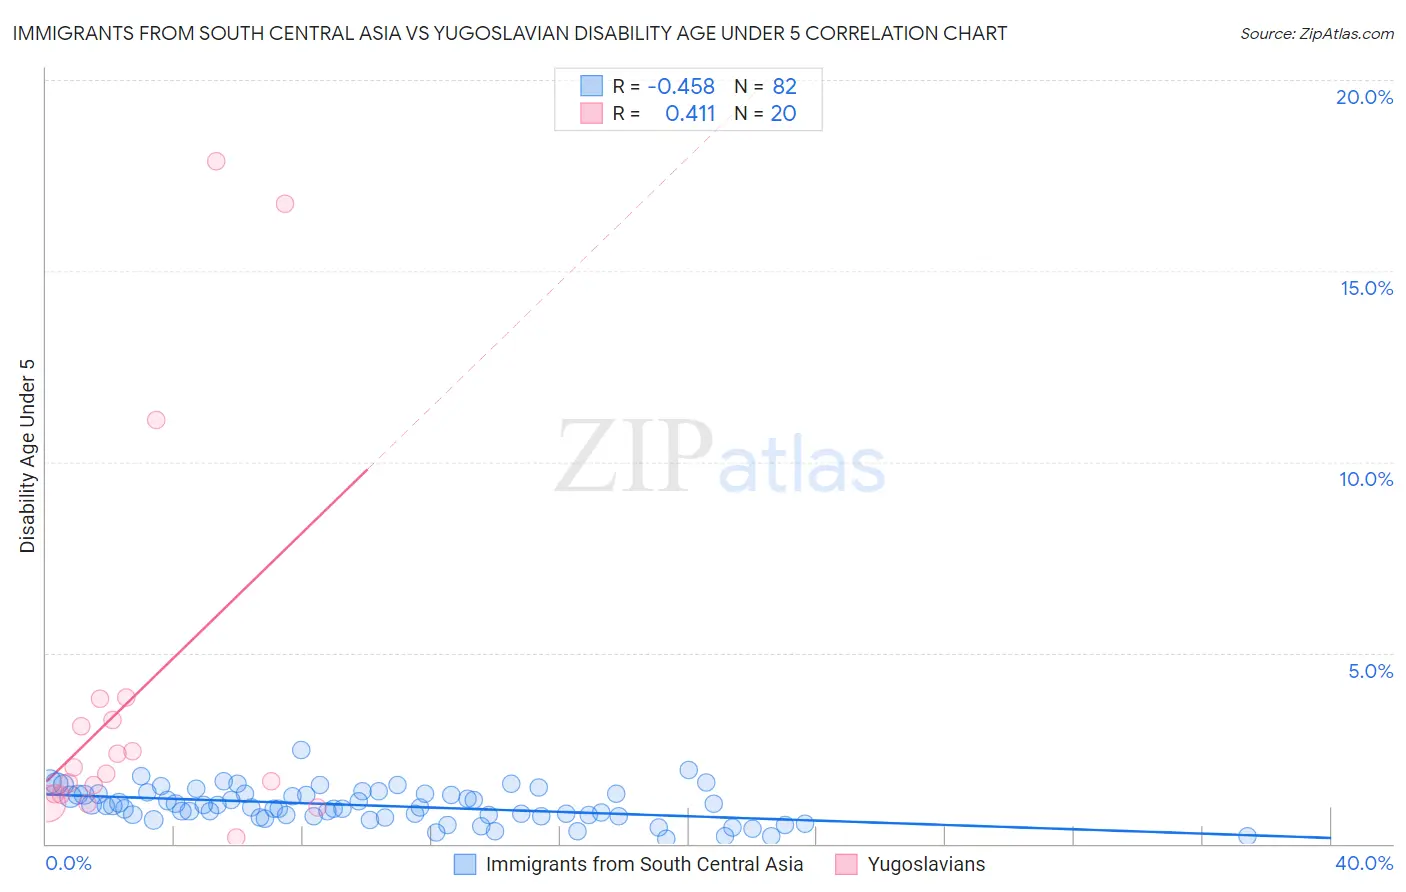
Immigrants from South Central Asia vs Yugoslavian Disability Age Under 5 Correlation Chart
The statistical analysis conducted on geographies consisting of 240,701,404 people shows a moderate negative correlation between the proportion of Immigrants from South Central Asia and percentage of population with a disability under the age of 5 in the United States with a correlation coefficient (R) of -0.458 and weighted average of 1.0%. Similarly, the statistical analysis conducted on geographies consisting of 169,705,353 people shows a moderate positive correlation between the proportion of Yugoslavians and percentage of population with a disability under the age of 5 in the United States with a correlation coefficient (R) of 0.411 and weighted average of 1.4%, a difference of 38.4%.
Disability Age Under 5 Correlation Summary
| Measurement | Immigrants from South Central Asia | Yugoslavian |
| Minimum | 0.13% | 0.18% |
| Maximum | 2.5% | 17.9% |
| Range | 2.3% | 17.7% |
| Mean | 1.0% | 3.9% |
| Median | 0.97% | 1.9% |
| Interquartile 25% (IQ1) | 0.72% | 1.3% |
| Interquartile 75% (IQ3) | 1.3% | 3.5% |
| Interquartile Range (IQR) | 0.59% | 2.2% |
| Standard Deviation (Sample) | 0.45% | 5.1% |
| Standard Deviation (Population) | 0.44% | 5.0% |
Similar Demographics by Disability Age Under 5
Demographics Similar to Immigrants from South Central Asia by Disability Age Under 5
In terms of disability age under 5, the demographic groups most similar to Immigrants from South Central Asia are Armenian (1.0%, a difference of 0.28%), Iranian (1.0%, a difference of 0.33%), Bolivian (1.0%, a difference of 0.51%), Immigrants from Belarus (1.0%, a difference of 0.52%), and Immigrants from Ukraine (1.0%, a difference of 0.63%).
| Demographics | Rating | Rank | Disability Age Under 5 |
| Yakama | 100.0 /100 | #23 | Exceptional 1.00% |
| Indians (Asian) | 100.0 /100 | #24 | Exceptional 1.0% |
| Immigrants | Micronesia | 100.0 /100 | #25 | Exceptional 1.0% |
| Immigrants | Taiwan | 100.0 /100 | #26 | Exceptional 1.0% |
| Guyanese | 100.0 /100 | #27 | Exceptional 1.0% |
| Immigrants | Eastern Asia | 100.0 /100 | #28 | Exceptional 1.0% |
| Immigrants | Belarus | 100.0 /100 | #29 | Exceptional 1.0% |
| Immigrants | South Central Asia | 99.9 /100 | #30 | Exceptional 1.0% |
| Armenians | 99.9 /100 | #31 | Exceptional 1.0% |
| Iranians | 99.9 /100 | #32 | Exceptional 1.0% |
| Bolivians | 99.9 /100 | #33 | Exceptional 1.0% |
| Immigrants | Ukraine | 99.9 /100 | #34 | Exceptional 1.0% |
| Barbadians | 99.9 /100 | #35 | Exceptional 1.0% |
| Immigrants | Nepal | 99.9 /100 | #36 | Exceptional 1.0% |
| Immigrants | India | 99.9 /100 | #37 | Exceptional 1.0% |
Demographics Similar to Yugoslavians by Disability Age Under 5
In terms of disability age under 5, the demographic groups most similar to Yugoslavians are Carpatho Rusyn (1.4%, a difference of 0.040%), Immigrants from Germany (1.4%, a difference of 0.080%), Spanish (1.4%, a difference of 0.15%), Immigrants from Dominica (1.4%, a difference of 0.21%), and Immigrants from Netherlands (1.4%, a difference of 0.37%).
| Demographics | Rating | Rank | Disability Age Under 5 |
| Slovenes | 0.3 /100 | #257 | Tragic 1.4% |
| Costa Ricans | 0.3 /100 | #258 | Tragic 1.4% |
| Immigrants | Southern Europe | 0.3 /100 | #259 | Tragic 1.4% |
| Slavs | 0.3 /100 | #260 | Tragic 1.4% |
| Immigrants | Netherlands | 0.2 /100 | #261 | Tragic 1.4% |
| Immigrants | Dominica | 0.2 /100 | #262 | Tragic 1.4% |
| Spanish | 0.2 /100 | #263 | Tragic 1.4% |
| Yugoslavians | 0.1 /100 | #264 | Tragic 1.4% |
| Carpatho Rusyns | 0.1 /100 | #265 | Tragic 1.4% |
| Immigrants | Germany | 0.1 /100 | #266 | Tragic 1.4% |
| Cree | 0.1 /100 | #267 | Tragic 1.4% |
| Belgians | 0.1 /100 | #268 | Tragic 1.4% |
| Austrians | 0.1 /100 | #269 | Tragic 1.4% |
| Immigrants | North America | 0.1 /100 | #270 | Tragic 1.4% |
| Immigrants | Canada | 0.1 /100 | #271 | Tragic 1.4% |