Immigrants from Senegal vs Australian Currently Married
COMPARE
Immigrants from Senegal
Australian
Currently Married
Currently Married Comparison
Immigrants from Senegal
Australians
40.7%
CURRENTLY MARRIED
0.0/ 100
METRIC RATING
324th/ 347
METRIC RANK
47.6%
CURRENTLY MARRIED
90.2/ 100
METRIC RATING
119th/ 347
METRIC RANK
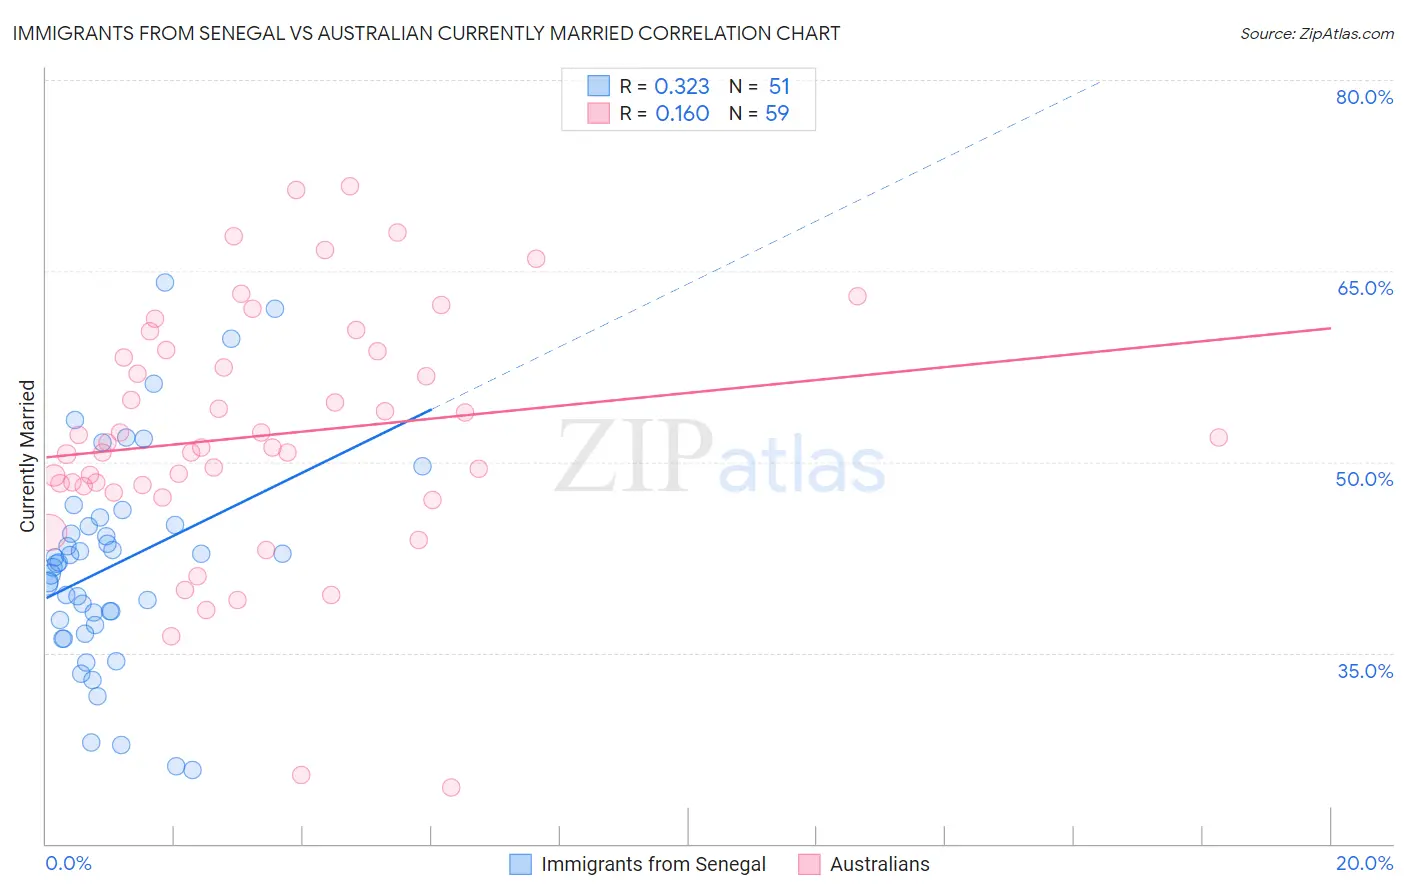
Immigrants from Senegal vs Australian Currently Married Correlation Chart
The statistical analysis conducted on geographies consisting of 90,127,337 people shows a mild positive correlation between the proportion of Immigrants from Senegal and percentage of population currently married in the United States with a correlation coefficient (R) of 0.323 and weighted average of 40.7%. Similarly, the statistical analysis conducted on geographies consisting of 224,121,967 people shows a poor positive correlation between the proportion of Australians and percentage of population currently married in the United States with a correlation coefficient (R) of 0.160 and weighted average of 47.6%, a difference of 16.9%.
Currently Married Correlation Summary
| Measurement | Immigrants from Senegal | Australian |
| Minimum | 25.8% | 24.4% |
| Maximum | 64.1% | 71.6% |
| Range | 38.3% | 47.2% |
| Mean | 41.9% | 52.1% |
| Median | 42.0% | 51.2% |
| Interquartile 25% (IQ1) | 37.2% | 48.1% |
| Interquartile 75% (IQ3) | 45.0% | 58.6% |
| Interquartile Range (IQR) | 7.8% | 10.6% |
| Standard Deviation (Sample) | 8.3% | 9.7% |
| Standard Deviation (Population) | 8.3% | 9.6% |
Similar Demographics by Currently Married
Demographics Similar to Immigrants from Senegal by Currently Married
In terms of currently married, the demographic groups most similar to Immigrants from Senegal are Immigrants from West Indies (40.7%, a difference of 0.010%), U.S. Virgin Islander (40.7%, a difference of 0.050%), Barbadian (40.6%, a difference of 0.19%), Senegalese (40.6%, a difference of 0.36%), and Arapaho (40.5%, a difference of 0.40%).
| Demographics | Rating | Rank | Currently Married |
| Haitians | 0.0 /100 | #317 | Tragic 41.3% |
| Bahamians | 0.0 /100 | #318 | Tragic 41.2% |
| Immigrants | Somalia | 0.0 /100 | #319 | Tragic 41.2% |
| Immigrants | Jamaica | 0.0 /100 | #320 | Tragic 41.1% |
| Immigrants | Congo | 0.0 /100 | #321 | Tragic 41.1% |
| Immigrants | Haiti | 0.0 /100 | #322 | Tragic 41.0% |
| Immigrants | West Indies | 0.0 /100 | #323 | Tragic 40.7% |
| Immigrants | Senegal | 0.0 /100 | #324 | Tragic 40.7% |
| U.S. Virgin Islanders | 0.0 /100 | #325 | Tragic 40.7% |
| Barbadians | 0.0 /100 | #326 | Tragic 40.6% |
| Senegalese | 0.0 /100 | #327 | Tragic 40.6% |
| Arapaho | 0.0 /100 | #328 | Tragic 40.5% |
| Crow | 0.0 /100 | #329 | Tragic 40.4% |
| Immigrants | Dominica | 0.0 /100 | #330 | Tragic 40.3% |
| Immigrants | Barbados | 0.0 /100 | #331 | Tragic 40.3% |
Demographics Similar to Australians by Currently Married
In terms of currently married, the demographic groups most similar to Australians are Immigrants from Philippines (47.6%, a difference of 0.0%), Puget Sound Salish (47.6%, a difference of 0.010%), Palestinian (47.6%, a difference of 0.020%), Immigrants from Indonesia (47.6%, a difference of 0.030%), and South African (47.6%, a difference of 0.040%).
| Demographics | Rating | Rank | Currently Married |
| Immigrants | Western Europe | 91.1 /100 | #112 | Exceptional 47.6% |
| Immigrants | Denmark | 90.9 /100 | #113 | Exceptional 47.6% |
| South Africans | 90.5 /100 | #114 | Exceptional 47.6% |
| Immigrants | Indonesia | 90.5 /100 | #115 | Exceptional 47.6% |
| Palestinians | 90.4 /100 | #116 | Exceptional 47.6% |
| Puget Sound Salish | 90.3 /100 | #117 | Exceptional 47.6% |
| Immigrants | Philippines | 90.2 /100 | #118 | Exceptional 47.6% |
| Australians | 90.2 /100 | #119 | Exceptional 47.6% |
| Syrians | 88.9 /100 | #120 | Excellent 47.5% |
| Immigrants | Croatia | 88.6 /100 | #121 | Excellent 47.5% |
| Osage | 87.9 /100 | #122 | Excellent 47.5% |
| Immigrants | Kazakhstan | 87.2 /100 | #123 | Excellent 47.4% |
| Laotians | 86.6 /100 | #124 | Excellent 47.4% |
| Okinawans | 85.3 /100 | #125 | Excellent 47.4% |
| Immigrants | Jordan | 84.9 /100 | #126 | Excellent 47.4% |