Immigrants from Senegal vs West Indian Ambulatory Disability
COMPARE
Immigrants from Senegal
West Indian
Ambulatory Disability
Ambulatory Disability Comparison
Immigrants from Senegal
West Indians
6.4%
AMBULATORY DISABILITY
1.7/ 100
METRIC RATING
240th/ 347
METRIC RANK
6.9%
AMBULATORY DISABILITY
0.0/ 100
METRIC RATING
291st/ 347
METRIC RANK
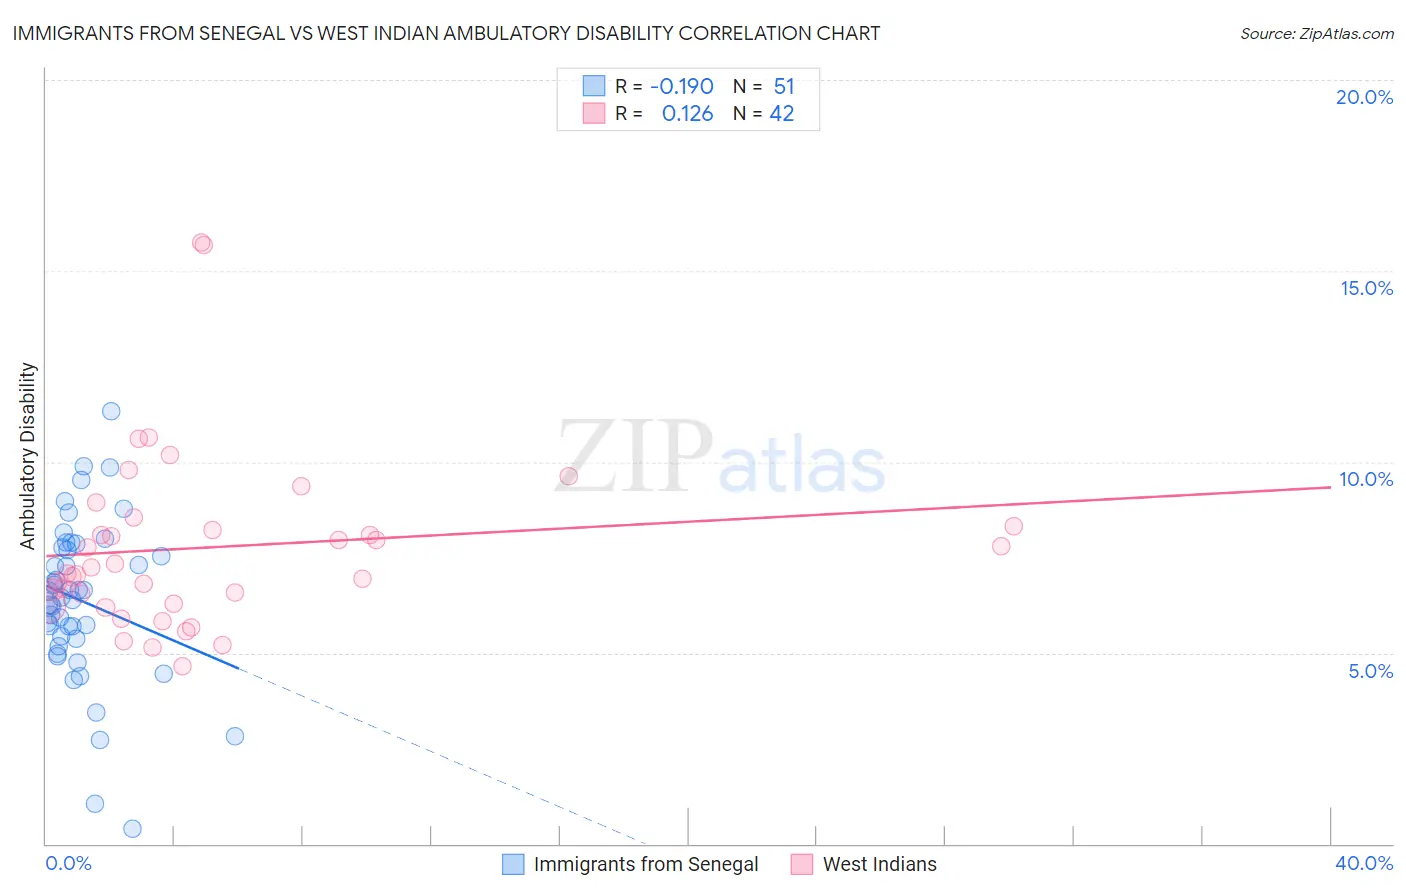
Immigrants from Senegal vs West Indian Ambulatory Disability Correlation Chart
The statistical analysis conducted on geographies consisting of 90,127,972 people shows a poor negative correlation between the proportion of Immigrants from Senegal and percentage of population with ambulatory disability in the United States with a correlation coefficient (R) of -0.190 and weighted average of 6.4%. Similarly, the statistical analysis conducted on geographies consisting of 253,984,061 people shows a poor positive correlation between the proportion of West Indians and percentage of population with ambulatory disability in the United States with a correlation coefficient (R) of 0.126 and weighted average of 6.9%, a difference of 6.6%.
Ambulatory Disability Correlation Summary
| Measurement | Immigrants from Senegal | West Indian |
| Minimum | 0.40% | 4.7% |
| Maximum | 11.3% | 15.7% |
| Range | 10.9% | 11.1% |
| Mean | 6.4% | 7.8% |
| Median | 6.4% | 7.2% |
| Interquartile 25% (IQ1) | 5.4% | 6.3% |
| Interquartile 75% (IQ3) | 7.7% | 8.3% |
| Interquartile Range (IQR) | 2.4% | 2.0% |
| Standard Deviation (Sample) | 2.1% | 2.3% |
| Standard Deviation (Population) | 2.1% | 2.3% |
Similar Demographics by Ambulatory Disability
Demographics Similar to Immigrants from Senegal by Ambulatory Disability
In terms of ambulatory disability, the demographic groups most similar to Immigrants from Senegal are Senegalese (6.4%, a difference of 0.030%), Immigrants from Haiti (6.5%, a difference of 0.080%), Haitian (6.4%, a difference of 0.090%), Immigrants from Germany (6.4%, a difference of 0.10%), and Spaniard (6.5%, a difference of 0.11%).
| Demographics | Rating | Rank | Ambulatory Disability |
| Sub-Saharan Africans | 2.3 /100 | #233 | Tragic 6.4% |
| Immigrants | Liberia | 2.3 /100 | #234 | Tragic 6.4% |
| Hispanics or Latinos | 2.2 /100 | #235 | Tragic 6.4% |
| Dutch | 2.0 /100 | #236 | Tragic 6.4% |
| Immigrants | Germany | 1.8 /100 | #237 | Tragic 6.4% |
| Haitians | 1.8 /100 | #238 | Tragic 6.4% |
| Senegalese | 1.7 /100 | #239 | Tragic 6.4% |
| Immigrants | Senegal | 1.7 /100 | #240 | Tragic 6.4% |
| Immigrants | Haiti | 1.6 /100 | #241 | Tragic 6.5% |
| Spaniards | 1.6 /100 | #242 | Tragic 6.5% |
| Germans | 1.5 /100 | #243 | Tragic 6.5% |
| Immigrants | Panama | 1.5 /100 | #244 | Tragic 6.5% |
| Tlingit-Haida | 1.5 /100 | #245 | Tragic 6.5% |
| Armenians | 1.5 /100 | #246 | Tragic 6.5% |
| Immigrants | Cuba | 1.4 /100 | #247 | Tragic 6.5% |
Demographics Similar to West Indians by Ambulatory Disability
In terms of ambulatory disability, the demographic groups most similar to West Indians are Cheyenne (6.9%, a difference of 0.060%), Scotch-Irish (6.9%, a difference of 0.10%), Immigrants from Dominica (6.9%, a difference of 0.12%), Nonimmigrants (6.9%, a difference of 0.27%), and Immigrants from St. Vincent and the Grenadines (6.9%, a difference of 0.30%).
| Demographics | Rating | Rank | Ambulatory Disability |
| Immigrants | Jamaica | 0.0 /100 | #284 | Tragic 6.8% |
| Fijians | 0.0 /100 | #285 | Tragic 6.8% |
| Yakama | 0.0 /100 | #286 | Tragic 6.8% |
| U.S. Virgin Islanders | 0.0 /100 | #287 | Tragic 6.8% |
| Immigrants | Nonimmigrants | 0.0 /100 | #288 | Tragic 6.9% |
| Immigrants | Dominica | 0.0 /100 | #289 | Tragic 6.9% |
| Scotch-Irish | 0.0 /100 | #290 | Tragic 6.9% |
| West Indians | 0.0 /100 | #291 | Tragic 6.9% |
| Cheyenne | 0.0 /100 | #292 | Tragic 6.9% |
| Immigrants | St. Vincent and the Grenadines | 0.0 /100 | #293 | Tragic 6.9% |
| Cape Verdeans | 0.0 /100 | #294 | Tragic 6.9% |
| Crow | 0.0 /100 | #295 | Tragic 6.9% |
| Alaskan Athabascans | 0.0 /100 | #296 | Tragic 6.9% |
| French American Indians | 0.0 /100 | #297 | Tragic 6.9% |
| Immigrants | Grenada | 0.0 /100 | #298 | Tragic 6.9% |