Immigrants from Senegal vs Immigrants from Cambodia Ambulatory Disability
COMPARE
Immigrants from Senegal
Immigrants from Cambodia
Ambulatory Disability
Ambulatory Disability Comparison
Immigrants from Senegal
Immigrants from Cambodia
6.4%
AMBULATORY DISABILITY
1.7/ 100
METRIC RATING
240th/ 347
METRIC RANK
6.2%
AMBULATORY DISABILITY
21.5/ 100
METRIC RATING
200th/ 347
METRIC RANK
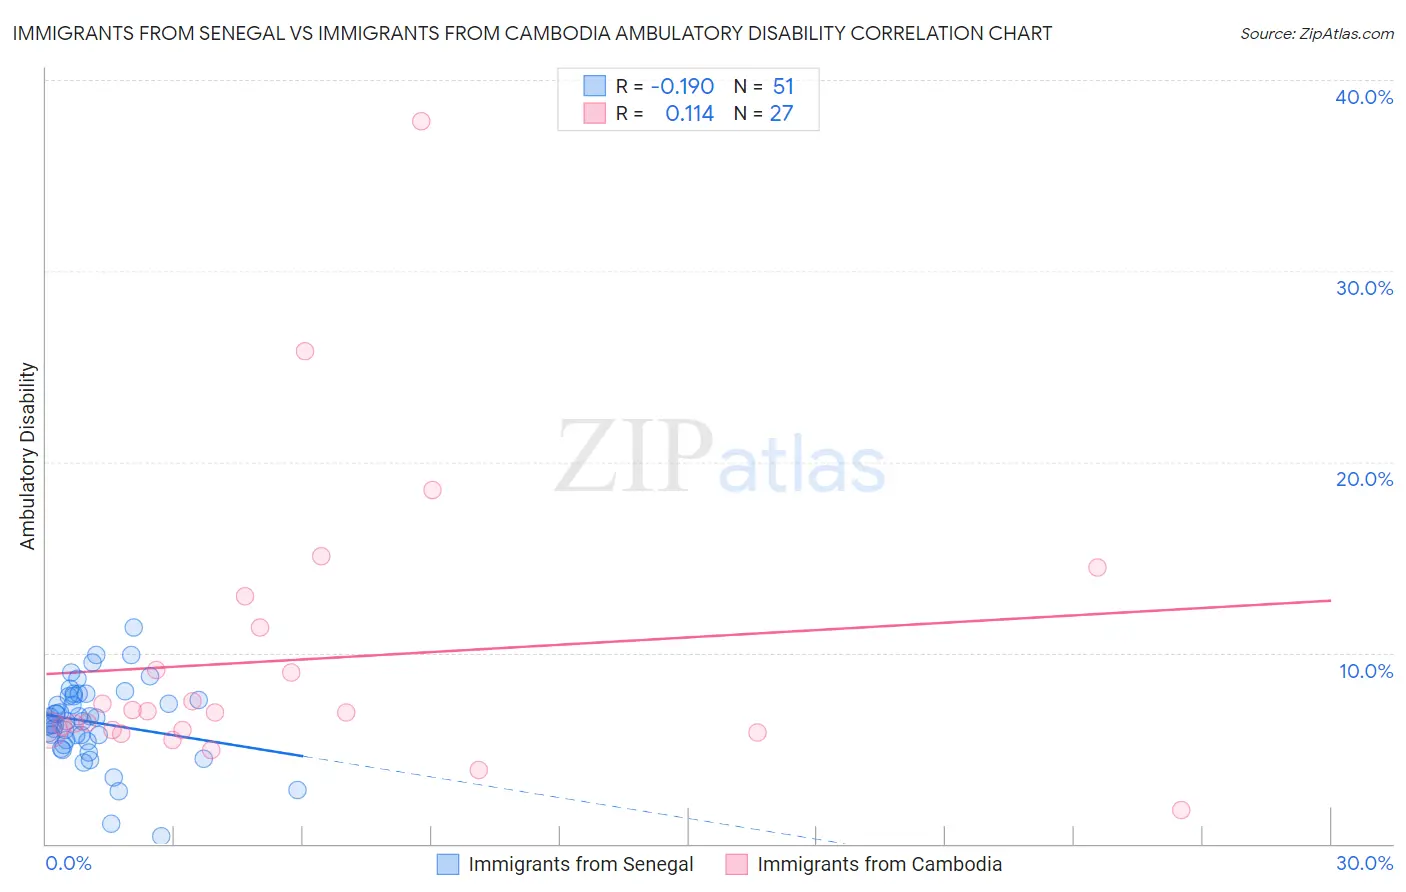
Immigrants from Senegal vs Immigrants from Cambodia Ambulatory Disability Correlation Chart
The statistical analysis conducted on geographies consisting of 90,127,972 people shows a poor negative correlation between the proportion of Immigrants from Senegal and percentage of population with ambulatory disability in the United States with a correlation coefficient (R) of -0.190 and weighted average of 6.4%. Similarly, the statistical analysis conducted on geographies consisting of 205,130,824 people shows a poor positive correlation between the proportion of Immigrants from Cambodia and percentage of population with ambulatory disability in the United States with a correlation coefficient (R) of 0.114 and weighted average of 6.2%, a difference of 3.6%.
Ambulatory Disability Correlation Summary
| Measurement | Immigrants from Senegal | Immigrants from Cambodia |
| Minimum | 0.40% | 1.8% |
| Maximum | 11.3% | 37.9% |
| Range | 10.9% | 36.1% |
| Mean | 6.4% | 9.7% |
| Median | 6.4% | 6.9% |
| Interquartile 25% (IQ1) | 5.4% | 5.9% |
| Interquartile 75% (IQ3) | 7.7% | 11.3% |
| Interquartile Range (IQR) | 2.4% | 5.4% |
| Standard Deviation (Sample) | 2.1% | 7.6% |
| Standard Deviation (Population) | 2.1% | 7.4% |
Similar Demographics by Ambulatory Disability
Demographics Similar to Immigrants from Senegal by Ambulatory Disability
In terms of ambulatory disability, the demographic groups most similar to Immigrants from Senegal are Senegalese (6.4%, a difference of 0.030%), Immigrants from Haiti (6.5%, a difference of 0.080%), Haitian (6.4%, a difference of 0.090%), Immigrants from Germany (6.4%, a difference of 0.10%), and Spaniard (6.5%, a difference of 0.11%).
| Demographics | Rating | Rank | Ambulatory Disability |
| Sub-Saharan Africans | 2.3 /100 | #233 | Tragic 6.4% |
| Immigrants | Liberia | 2.3 /100 | #234 | Tragic 6.4% |
| Hispanics or Latinos | 2.2 /100 | #235 | Tragic 6.4% |
| Dutch | 2.0 /100 | #236 | Tragic 6.4% |
| Immigrants | Germany | 1.8 /100 | #237 | Tragic 6.4% |
| Haitians | 1.8 /100 | #238 | Tragic 6.4% |
| Senegalese | 1.7 /100 | #239 | Tragic 6.4% |
| Immigrants | Senegal | 1.7 /100 | #240 | Tragic 6.4% |
| Immigrants | Haiti | 1.6 /100 | #241 | Tragic 6.5% |
| Spaniards | 1.6 /100 | #242 | Tragic 6.5% |
| Germans | 1.5 /100 | #243 | Tragic 6.5% |
| Immigrants | Panama | 1.5 /100 | #244 | Tragic 6.5% |
| Tlingit-Haida | 1.5 /100 | #245 | Tragic 6.5% |
| Armenians | 1.5 /100 | #246 | Tragic 6.5% |
| Immigrants | Cuba | 1.4 /100 | #247 | Tragic 6.5% |
Demographics Similar to Immigrants from Cambodia by Ambulatory Disability
In terms of ambulatory disability, the demographic groups most similar to Immigrants from Cambodia are Italian (6.2%, a difference of 0.080%), Immigrants from Central America (6.2%, a difference of 0.11%), Albanian (6.2%, a difference of 0.14%), Immigrants from Bangladesh (6.2%, a difference of 0.22%), and Immigrants from Ukraine (6.2%, a difference of 0.25%).
| Demographics | Rating | Rank | Ambulatory Disability |
| Guatemalans | 30.0 /100 | #193 | Fair 6.2% |
| Alaska Natives | 29.8 /100 | #194 | Fair 6.2% |
| Belgians | 28.6 /100 | #195 | Fair 6.2% |
| Malaysians | 28.2 /100 | #196 | Fair 6.2% |
| Poles | 26.3 /100 | #197 | Fair 6.2% |
| Immigrants | Bangladesh | 24.6 /100 | #198 | Fair 6.2% |
| Italians | 22.6 /100 | #199 | Fair 6.2% |
| Immigrants | Cambodia | 21.5 /100 | #200 | Fair 6.2% |
| Immigrants | Central America | 20.1 /100 | #201 | Fair 6.2% |
| Albanians | 19.7 /100 | #202 | Poor 6.2% |
| Immigrants | Ukraine | 18.4 /100 | #203 | Poor 6.2% |
| Immigrants | Congo | 18.2 /100 | #204 | Poor 6.2% |
| Slovenes | 18.0 /100 | #205 | Poor 6.2% |
| Finns | 17.2 /100 | #206 | Poor 6.2% |
| Alsatians | 15.1 /100 | #207 | Poor 6.3% |