Immigrants from Senegal vs German Russian Ambulatory Disability
COMPARE
Immigrants from Senegal
German Russian
Ambulatory Disability
Ambulatory Disability Comparison
Immigrants from Senegal
German Russians
6.4%
AMBULATORY DISABILITY
1.7/ 100
METRIC RATING
240th/ 347
METRIC RANK
6.3%
AMBULATORY DISABILITY
9.4/ 100
METRIC RATING
222nd/ 347
METRIC RANK
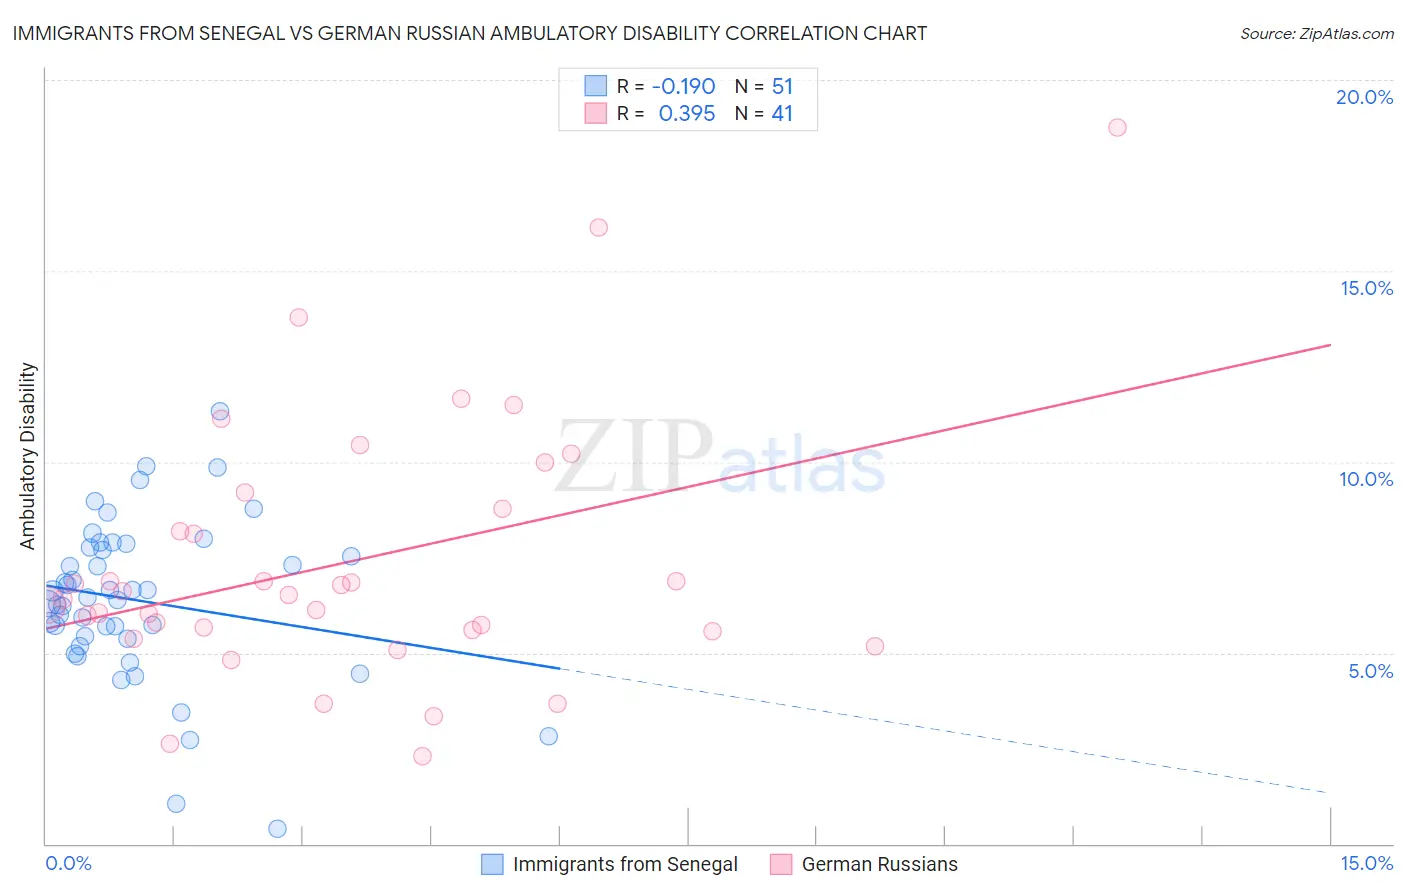
Immigrants from Senegal vs German Russian Ambulatory Disability Correlation Chart
The statistical analysis conducted on geographies consisting of 90,127,972 people shows a poor negative correlation between the proportion of Immigrants from Senegal and percentage of population with ambulatory disability in the United States with a correlation coefficient (R) of -0.190 and weighted average of 6.4%. Similarly, the statistical analysis conducted on geographies consisting of 96,455,793 people shows a mild positive correlation between the proportion of German Russians and percentage of population with ambulatory disability in the United States with a correlation coefficient (R) of 0.395 and weighted average of 6.3%, a difference of 2.3%.
Ambulatory Disability Correlation Summary
| Measurement | Immigrants from Senegal | German Russian |
| Minimum | 0.40% | 2.3% |
| Maximum | 11.3% | 18.8% |
| Range | 10.9% | 16.5% |
| Mean | 6.4% | 7.4% |
| Median | 6.4% | 6.5% |
| Interquartile 25% (IQ1) | 5.4% | 5.6% |
| Interquartile 75% (IQ3) | 7.7% | 9.0% |
| Interquartile Range (IQR) | 2.4% | 3.4% |
| Standard Deviation (Sample) | 2.1% | 3.4% |
| Standard Deviation (Population) | 2.1% | 3.4% |
Demographics Similar to Immigrants from Senegal and German Russians by Ambulatory Disability
In terms of ambulatory disability, the demographic groups most similar to Immigrants from Senegal are Senegalese (6.4%, a difference of 0.030%), Immigrants from Haiti (6.5%, a difference of 0.080%), Haitian (6.4%, a difference of 0.090%), Immigrants from Germany (6.4%, a difference of 0.10%), and Dutch (6.4%, a difference of 0.19%). Similarly, the demographic groups most similar to German Russians are Hungarian (6.3%, a difference of 0.030%), Immigrants from Honduras (6.3%, a difference of 0.29%), Liberian (6.3%, a difference of 0.39%), Honduran (6.3%, a difference of 0.56%), and Slavic (6.4%, a difference of 0.84%).
| Demographics | Rating | Rank | Ambulatory Disability |
| Hungarians | 9.6 /100 | #221 | Tragic 6.3% |
| German Russians | 9.4 /100 | #222 | Tragic 6.3% |
| Immigrants | Honduras | 7.6 /100 | #223 | Tragic 6.3% |
| Liberians | 7.1 /100 | #224 | Tragic 6.3% |
| Hondurans | 6.3 /100 | #225 | Tragic 6.3% |
| Slavs | 5.1 /100 | #226 | Tragic 6.4% |
| Cubans | 4.0 /100 | #227 | Tragic 6.4% |
| Portuguese | 4.0 /100 | #228 | Tragic 6.4% |
| Czechoslovakians | 3.8 /100 | #229 | Tragic 6.4% |
| Mexicans | 3.5 /100 | #230 | Tragic 6.4% |
| Panamanians | 3.1 /100 | #231 | Tragic 6.4% |
| Assyrians/Chaldeans/Syriacs | 2.4 /100 | #232 | Tragic 6.4% |
| Sub-Saharan Africans | 2.3 /100 | #233 | Tragic 6.4% |
| Immigrants | Liberia | 2.3 /100 | #234 | Tragic 6.4% |
| Hispanics or Latinos | 2.2 /100 | #235 | Tragic 6.4% |
| Dutch | 2.0 /100 | #236 | Tragic 6.4% |
| Immigrants | Germany | 1.8 /100 | #237 | Tragic 6.4% |
| Haitians | 1.8 /100 | #238 | Tragic 6.4% |
| Senegalese | 1.7 /100 | #239 | Tragic 6.4% |
| Immigrants | Senegal | 1.7 /100 | #240 | Tragic 6.4% |
| Immigrants | Haiti | 1.6 /100 | #241 | Tragic 6.5% |