Immigrants from Russia vs White/Caucasian Disability
COMPARE
Immigrants from Russia
White/Caucasian
Disability
Disability Comparison
Immigrants from Russia
Whites/Caucasians
11.1%
DISABILITY
98.9/ 100
METRIC RATING
86th/ 347
METRIC RANK
13.0%
DISABILITY
0.0/ 100
METRIC RATING
288th/ 347
METRIC RANK
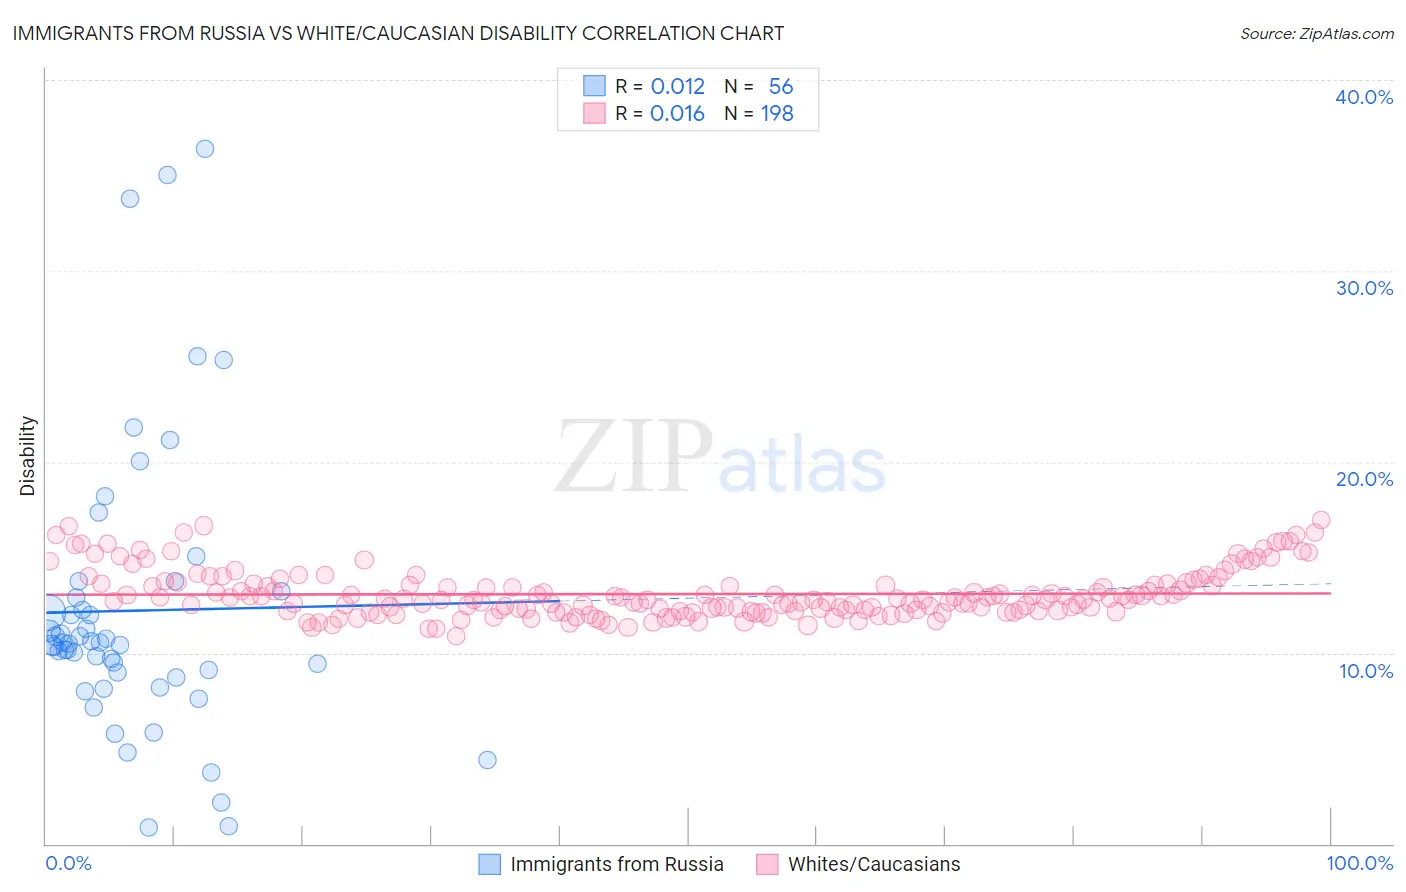
Immigrants from Russia vs White/Caucasian Disability Correlation Chart
The statistical analysis conducted on geographies consisting of 347,926,154 people shows no correlation between the proportion of Immigrants from Russia and percentage of population with a disability in the United States with a correlation coefficient (R) of 0.012 and weighted average of 11.1%. Similarly, the statistical analysis conducted on geographies consisting of 583,070,894 people shows no correlation between the proportion of Whites/Caucasians and percentage of population with a disability in the United States with a correlation coefficient (R) of 0.016 and weighted average of 13.0%, a difference of 17.1%.
Disability Correlation Summary
| Measurement | Immigrants from Russia | White/Caucasian |
| Minimum | 0.87% | 10.9% |
| Maximum | 36.4% | 16.9% |
| Range | 35.5% | 6.1% |
| Mean | 12.2% | 13.1% |
| Median | 10.5% | 12.8% |
| Interquartile 25% (IQ1) | 8.9% | 12.2% |
| Interquartile 75% (IQ3) | 13.1% | 13.6% |
| Interquartile Range (IQR) | 4.2% | 1.4% |
| Standard Deviation (Sample) | 7.5% | 1.3% |
| Standard Deviation (Population) | 7.4% | 1.3% |
Similar Demographics by Disability
Demographics Similar to Immigrants from Russia by Disability
In terms of disability, the demographic groups most similar to Immigrants from Russia are Immigrants from Belarus (11.1%, a difference of 0.0%), Palestinian (11.1%, a difference of 0.040%), Immigrants from Sierra Leone (11.1%, a difference of 0.15%), Immigrants from Switzerland (11.1%, a difference of 0.17%), and Chilean (11.1%, a difference of 0.20%).
| Demographics | Rating | Rank | Disability |
| Immigrants | Jordan | 99.3 /100 | #79 | Exceptional 11.1% |
| Immigrants | Ireland | 99.3 /100 | #80 | Exceptional 11.1% |
| Immigrants | Poland | 99.1 /100 | #81 | Exceptional 11.1% |
| Chileans | 99.1 /100 | #82 | Exceptional 11.1% |
| Immigrants | Switzerland | 99.0 /100 | #83 | Exceptional 11.1% |
| Immigrants | Sierra Leone | 99.0 /100 | #84 | Exceptional 11.1% |
| Immigrants | Belarus | 98.9 /100 | #85 | Exceptional 11.1% |
| Immigrants | Russia | 98.9 /100 | #86 | Exceptional 11.1% |
| Palestinians | 98.9 /100 | #87 | Exceptional 11.1% |
| Immigrants | Romania | 98.5 /100 | #88 | Exceptional 11.2% |
| Immigrants | South Africa | 98.2 /100 | #89 | Exceptional 11.2% |
| Immigrants | Brazil | 98.1 /100 | #90 | Exceptional 11.2% |
| Immigrants | Western Asia | 98.1 /100 | #91 | Exceptional 11.2% |
| Ecuadorians | 98.0 /100 | #92 | Exceptional 11.2% |
| Immigrants | Ecuador | 98.0 /100 | #93 | Exceptional 11.2% |
Demographics Similar to Whites/Caucasians by Disability
In terms of disability, the demographic groups most similar to Whites/Caucasians are Slovak (13.0%, a difference of 0.0%), African (13.0%, a difference of 0.020%), Cheyenne (13.0%, a difference of 0.060%), Yaqui (13.1%, a difference of 0.29%), and English (13.0%, a difference of 0.43%).
| Demographics | Rating | Rank | Disability |
| Immigrants | Portugal | 0.0 /100 | #281 | Tragic 12.9% |
| Scottish | 0.0 /100 | #282 | Tragic 12.9% |
| Irish | 0.0 /100 | #283 | Tragic 12.9% |
| Welsh | 0.0 /100 | #284 | Tragic 12.9% |
| Crow | 0.0 /100 | #285 | Tragic 12.9% |
| English | 0.0 /100 | #286 | Tragic 13.0% |
| Africans | 0.0 /100 | #287 | Tragic 13.0% |
| Whites/Caucasians | 0.0 /100 | #288 | Tragic 13.0% |
| Slovaks | 0.0 /100 | #289 | Tragic 13.0% |
| Cheyenne | 0.0 /100 | #290 | Tragic 13.0% |
| Yaqui | 0.0 /100 | #291 | Tragic 13.1% |
| Aleuts | 0.0 /100 | #292 | Tragic 13.1% |
| Marshallese | 0.0 /100 | #293 | Tragic 13.1% |
| Celtics | 0.0 /100 | #294 | Tragic 13.1% |
| Immigrants | Nonimmigrants | 0.0 /100 | #295 | Tragic 13.2% |