Osage vs White/Caucasian Disability
COMPARE
Osage
White/Caucasian
Disability
Disability Comparison
Osage
Whites/Caucasians
14.2%
DISABILITY
0.0/ 100
METRIC RATING
326th/ 347
METRIC RANK
13.0%
DISABILITY
0.0/ 100
METRIC RATING
288th/ 347
METRIC RANK
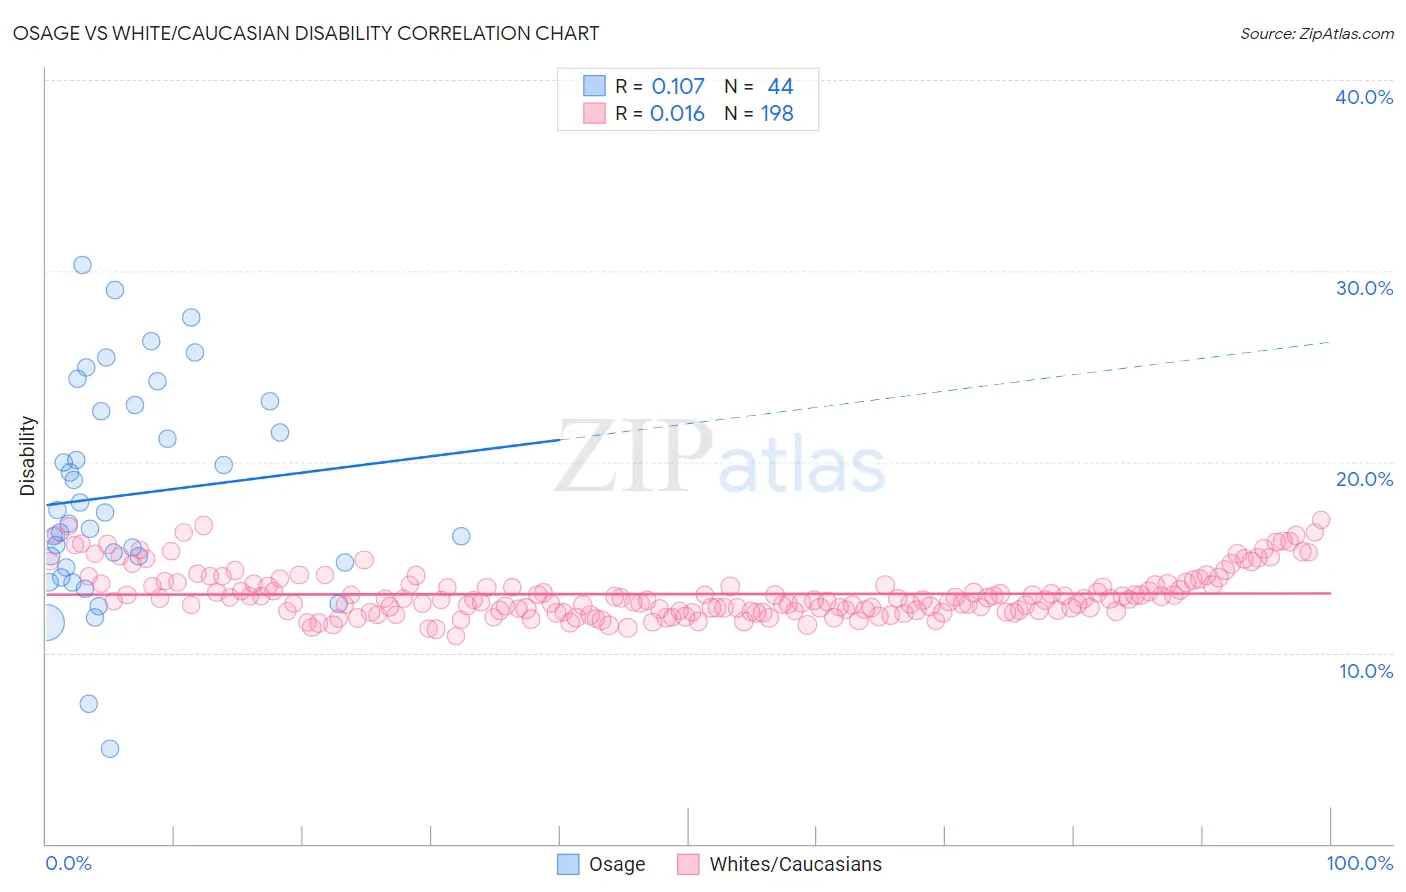
Osage vs White/Caucasian Disability Correlation Chart
The statistical analysis conducted on geographies consisting of 91,799,709 people shows a poor positive correlation between the proportion of Osage and percentage of population with a disability in the United States with a correlation coefficient (R) of 0.107 and weighted average of 14.2%. Similarly, the statistical analysis conducted on geographies consisting of 583,070,894 people shows no correlation between the proportion of Whites/Caucasians and percentage of population with a disability in the United States with a correlation coefficient (R) of 0.016 and weighted average of 13.0%, a difference of 8.8%.
Disability Correlation Summary
| Measurement | Osage | White/Caucasian |
| Minimum | 5.0% | 10.9% |
| Maximum | 30.3% | 16.9% |
| Range | 25.3% | 6.1% |
| Mean | 18.3% | 13.1% |
| Median | 17.0% | 12.8% |
| Interquartile 25% (IQ1) | 14.6% | 12.2% |
| Interquartile 75% (IQ3) | 22.8% | 13.6% |
| Interquartile Range (IQR) | 8.2% | 1.4% |
| Standard Deviation (Sample) | 5.6% | 1.3% |
| Standard Deviation (Population) | 5.6% | 1.3% |
Similar Demographics by Disability
Demographics Similar to Osage by Disability
In terms of disability, the demographic groups most similar to Osage are Ottawa (14.2%, a difference of 0.020%), Immigrants from the Azores (14.2%, a difference of 0.020%), Native/Alaskan (14.2%, a difference of 0.030%), Chippewa (14.1%, a difference of 0.080%), and Potawatomi (14.2%, a difference of 0.14%).
| Demographics | Rating | Rank | Disability |
| Iroquois | 0.0 /100 | #319 | Tragic 13.8% |
| Apache | 0.0 /100 | #320 | Tragic 13.9% |
| Paiute | 0.0 /100 | #321 | Tragic 13.9% |
| Americans | 0.0 /100 | #322 | Tragic 13.9% |
| Comanche | 0.0 /100 | #323 | Tragic 14.1% |
| Chippewa | 0.0 /100 | #324 | Tragic 14.1% |
| Natives/Alaskans | 0.0 /100 | #325 | Tragic 14.2% |
| Osage | 0.0 /100 | #326 | Tragic 14.2% |
| Ottawa | 0.0 /100 | #327 | Tragic 14.2% |
| Immigrants | Azores | 0.0 /100 | #328 | Tragic 14.2% |
| Potawatomi | 0.0 /100 | #329 | Tragic 14.2% |
| Navajo | 0.0 /100 | #330 | Tragic 14.3% |
| Alaskan Athabascans | 0.0 /100 | #331 | Tragic 14.4% |
| Pueblo | 0.0 /100 | #332 | Tragic 14.4% |
| Cajuns | 0.0 /100 | #333 | Tragic 14.6% |
Demographics Similar to Whites/Caucasians by Disability
In terms of disability, the demographic groups most similar to Whites/Caucasians are Slovak (13.0%, a difference of 0.0%), African (13.0%, a difference of 0.020%), Cheyenne (13.0%, a difference of 0.060%), Yaqui (13.1%, a difference of 0.29%), and English (13.0%, a difference of 0.43%).
| Demographics | Rating | Rank | Disability |
| Immigrants | Portugal | 0.0 /100 | #281 | Tragic 12.9% |
| Scottish | 0.0 /100 | #282 | Tragic 12.9% |
| Irish | 0.0 /100 | #283 | Tragic 12.9% |
| Welsh | 0.0 /100 | #284 | Tragic 12.9% |
| Crow | 0.0 /100 | #285 | Tragic 12.9% |
| English | 0.0 /100 | #286 | Tragic 13.0% |
| Africans | 0.0 /100 | #287 | Tragic 13.0% |
| Whites/Caucasians | 0.0 /100 | #288 | Tragic 13.0% |
| Slovaks | 0.0 /100 | #289 | Tragic 13.0% |
| Cheyenne | 0.0 /100 | #290 | Tragic 13.0% |
| Yaqui | 0.0 /100 | #291 | Tragic 13.1% |
| Aleuts | 0.0 /100 | #292 | Tragic 13.1% |
| Marshallese | 0.0 /100 | #293 | Tragic 13.1% |
| Celtics | 0.0 /100 | #294 | Tragic 13.1% |
| Immigrants | Nonimmigrants | 0.0 /100 | #295 | Tragic 13.2% |