Tlingit-Haida vs White/Caucasian Disability
COMPARE
Tlingit-Haida
White/Caucasian
Disability
Disability Comparison
Tlingit-Haida
Whites/Caucasians
13.5%
DISABILITY
0.0/ 100
METRIC RATING
309th/ 347
METRIC RANK
13.0%
DISABILITY
0.0/ 100
METRIC RATING
288th/ 347
METRIC RANK
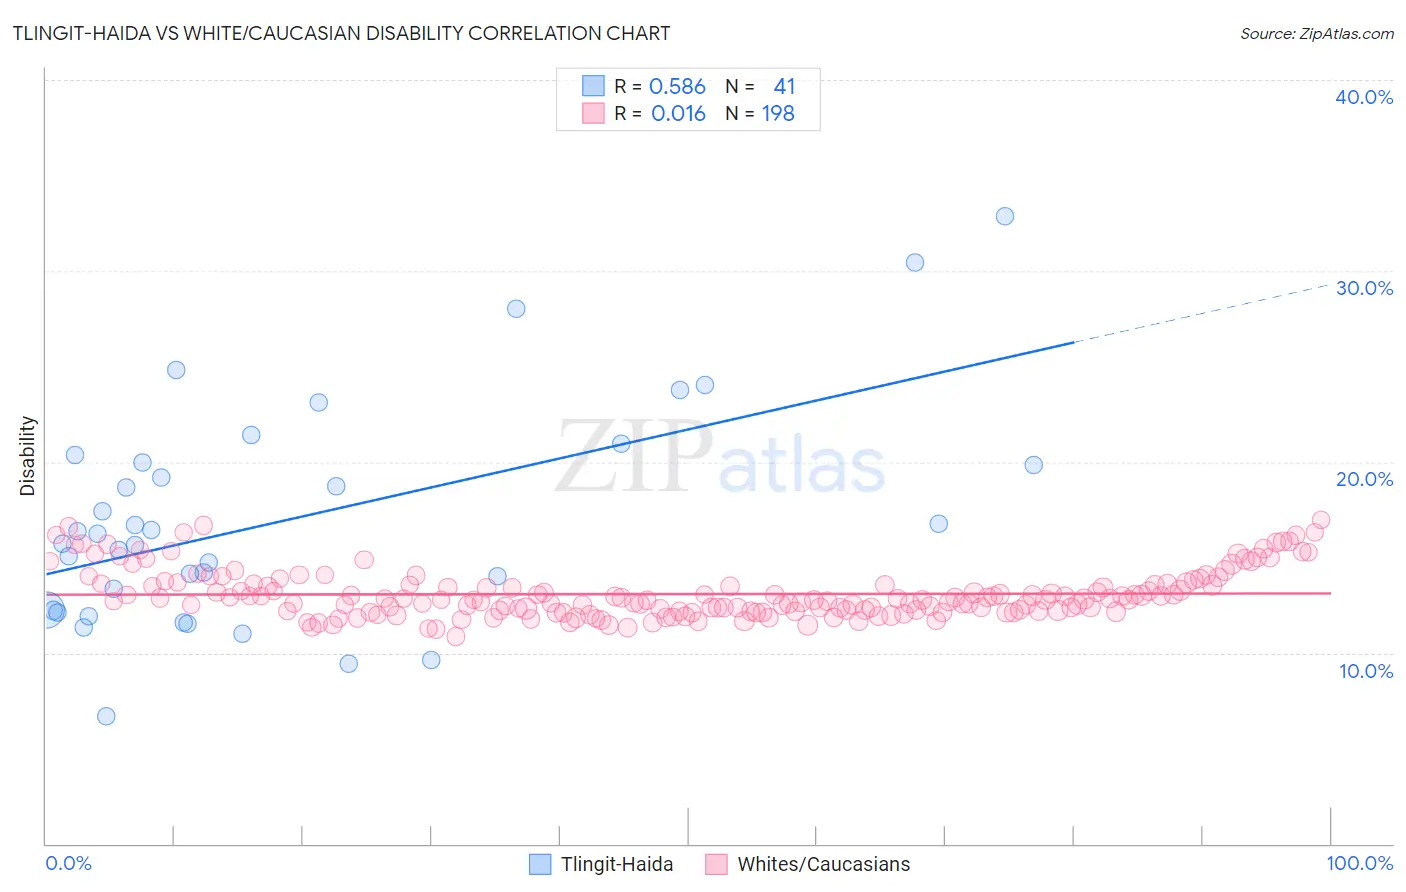
Tlingit-Haida vs White/Caucasian Disability Correlation Chart
The statistical analysis conducted on geographies consisting of 60,854,514 people shows a substantial positive correlation between the proportion of Tlingit-Haida and percentage of population with a disability in the United States with a correlation coefficient (R) of 0.586 and weighted average of 13.5%. Similarly, the statistical analysis conducted on geographies consisting of 583,070,894 people shows no correlation between the proportion of Whites/Caucasians and percentage of population with a disability in the United States with a correlation coefficient (R) of 0.016 and weighted average of 13.0%, a difference of 4.0%.
Disability Correlation Summary
| Measurement | Tlingit-Haida | White/Caucasian |
| Minimum | 6.7% | 10.9% |
| Maximum | 32.8% | 16.9% |
| Range | 26.1% | 6.1% |
| Mean | 17.0% | 13.1% |
| Median | 16.3% | 12.8% |
| Interquartile 25% (IQ1) | 12.2% | 12.2% |
| Interquartile 75% (IQ3) | 20.2% | 13.6% |
| Interquartile Range (IQR) | 8.0% | 1.4% |
| Standard Deviation (Sample) | 5.7% | 1.3% |
| Standard Deviation (Population) | 5.7% | 1.3% |
Similar Demographics by Disability
Demographics Similar to Tlingit-Haida by Disability
In terms of disability, the demographic groups most similar to Tlingit-Haida are French American Indian (13.5%, a difference of 0.080%), Shoshone (13.5%, a difference of 0.18%), Cape Verdean (13.5%, a difference of 0.23%), Blackfeet (13.6%, a difference of 0.53%), and Delaware (13.6%, a difference of 0.56%).
| Demographics | Rating | Rank | Disability |
| Arapaho | 0.0 /100 | #302 | Tragic 13.2% |
| Scotch-Irish | 0.0 /100 | #303 | Tragic 13.3% |
| Yakama | 0.0 /100 | #304 | Tragic 13.4% |
| French Canadians | 0.0 /100 | #305 | Tragic 13.4% |
| Cape Verdeans | 0.0 /100 | #306 | Tragic 13.5% |
| Shoshone | 0.0 /100 | #307 | Tragic 13.5% |
| French American Indians | 0.0 /100 | #308 | Tragic 13.5% |
| Tlingit-Haida | 0.0 /100 | #309 | Tragic 13.5% |
| Blackfeet | 0.0 /100 | #310 | Tragic 13.6% |
| Delaware | 0.0 /100 | #311 | Tragic 13.6% |
| Spanish Americans | 0.0 /100 | #312 | Tragic 13.6% |
| Cree | 0.0 /100 | #313 | Tragic 13.7% |
| Blacks/African Americans | 0.0 /100 | #314 | Tragic 13.7% |
| Puget Sound Salish | 0.0 /100 | #315 | Tragic 13.7% |
| Pima | 0.0 /100 | #316 | Tragic 13.7% |
Demographics Similar to Whites/Caucasians by Disability
In terms of disability, the demographic groups most similar to Whites/Caucasians are Slovak (13.0%, a difference of 0.0%), African (13.0%, a difference of 0.020%), Cheyenne (13.0%, a difference of 0.060%), Yaqui (13.1%, a difference of 0.29%), and English (13.0%, a difference of 0.43%).
| Demographics | Rating | Rank | Disability |
| Immigrants | Portugal | 0.0 /100 | #281 | Tragic 12.9% |
| Scottish | 0.0 /100 | #282 | Tragic 12.9% |
| Irish | 0.0 /100 | #283 | Tragic 12.9% |
| Welsh | 0.0 /100 | #284 | Tragic 12.9% |
| Crow | 0.0 /100 | #285 | Tragic 12.9% |
| English | 0.0 /100 | #286 | Tragic 13.0% |
| Africans | 0.0 /100 | #287 | Tragic 13.0% |
| Whites/Caucasians | 0.0 /100 | #288 | Tragic 13.0% |
| Slovaks | 0.0 /100 | #289 | Tragic 13.0% |
| Cheyenne | 0.0 /100 | #290 | Tragic 13.0% |
| Yaqui | 0.0 /100 | #291 | Tragic 13.1% |
| Aleuts | 0.0 /100 | #292 | Tragic 13.1% |
| Marshallese | 0.0 /100 | #293 | Tragic 13.1% |
| Celtics | 0.0 /100 | #294 | Tragic 13.1% |
| Immigrants | Nonimmigrants | 0.0 /100 | #295 | Tragic 13.2% |