Menominee vs White/Caucasian Disability
COMPARE
Menominee
White/Caucasian
Disability
Disability Comparison
Menominee
Whites/Caucasians
13.8%
DISABILITY
0.0/ 100
METRIC RATING
318th/ 347
METRIC RANK
13.0%
DISABILITY
0.0/ 100
METRIC RATING
288th/ 347
METRIC RANK
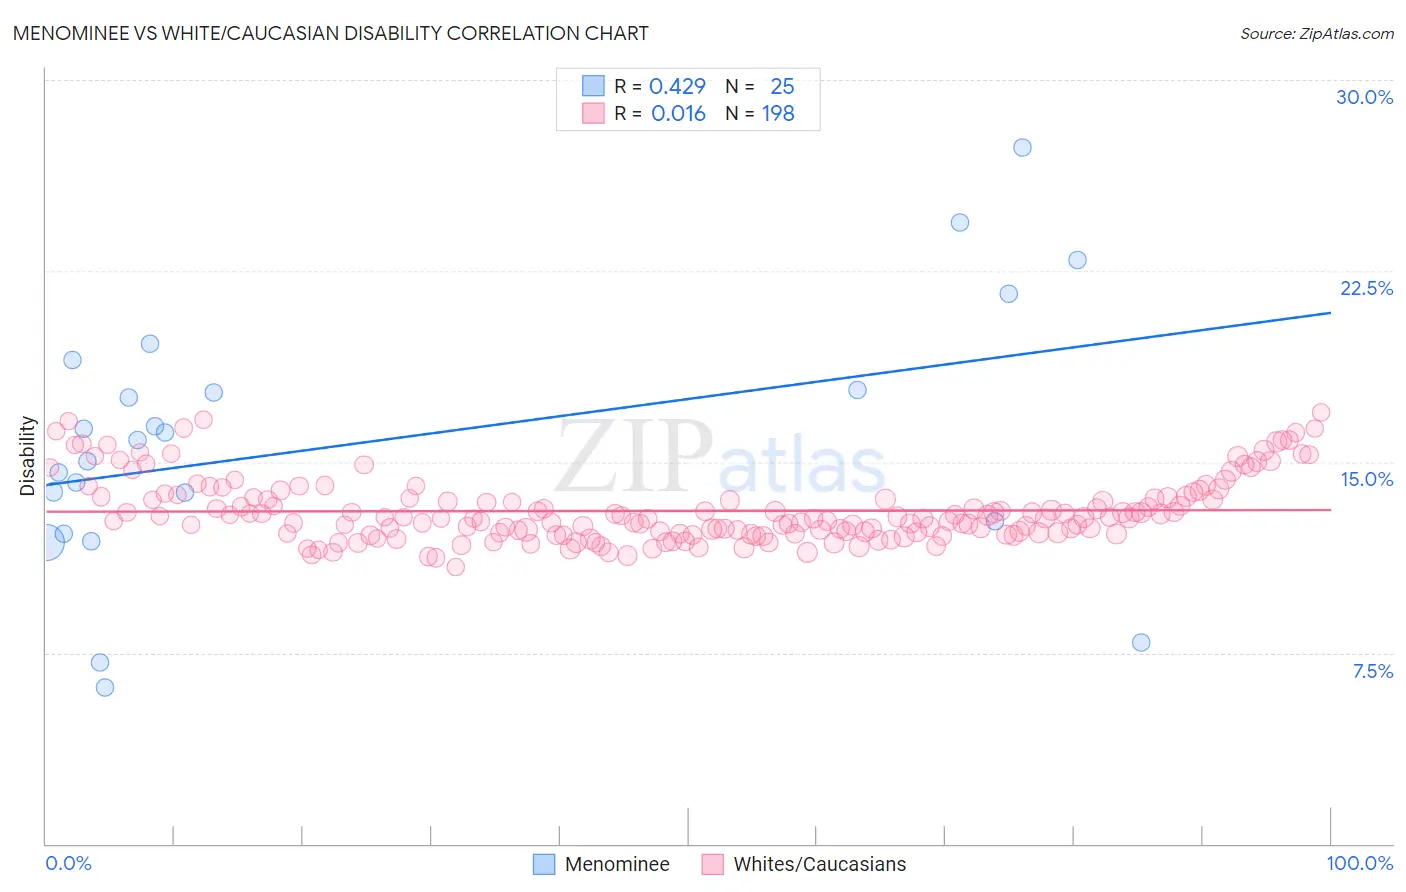
Menominee vs White/Caucasian Disability Correlation Chart
The statistical analysis conducted on geographies consisting of 45,777,730 people shows a moderate positive correlation between the proportion of Menominee and percentage of population with a disability in the United States with a correlation coefficient (R) of 0.429 and weighted average of 13.8%. Similarly, the statistical analysis conducted on geographies consisting of 583,070,894 people shows no correlation between the proportion of Whites/Caucasians and percentage of population with a disability in the United States with a correlation coefficient (R) of 0.016 and weighted average of 13.0%, a difference of 5.9%.
Disability Correlation Summary
| Measurement | Menominee | White/Caucasian |
| Minimum | 6.2% | 10.9% |
| Maximum | 27.3% | 16.9% |
| Range | 21.2% | 6.1% |
| Mean | 15.8% | 13.1% |
| Median | 15.9% | 12.8% |
| Interquartile 25% (IQ1) | 12.4% | 12.2% |
| Interquartile 75% (IQ3) | 18.4% | 13.6% |
| Interquartile Range (IQR) | 6.0% | 1.4% |
| Standard Deviation (Sample) | 5.1% | 1.3% |
| Standard Deviation (Population) | 5.0% | 1.3% |
Similar Demographics by Disability
Demographics Similar to Menominee by Disability
In terms of disability, the demographic groups most similar to Menominee are Iroquois (13.8%, a difference of 0.21%), Apache (13.9%, a difference of 0.51%), Pima (13.7%, a difference of 0.58%), Immigrants from Cabo Verde (13.7%, a difference of 0.58%), and Puget Sound Salish (13.7%, a difference of 0.60%).
| Demographics | Rating | Rank | Disability |
| Delaware | 0.0 /100 | #311 | Tragic 13.6% |
| Spanish Americans | 0.0 /100 | #312 | Tragic 13.6% |
| Cree | 0.0 /100 | #313 | Tragic 13.7% |
| Blacks/African Americans | 0.0 /100 | #314 | Tragic 13.7% |
| Puget Sound Salish | 0.0 /100 | #315 | Tragic 13.7% |
| Pima | 0.0 /100 | #316 | Tragic 13.7% |
| Immigrants | Cabo Verde | 0.0 /100 | #317 | Tragic 13.7% |
| Menominee | 0.0 /100 | #318 | Tragic 13.8% |
| Iroquois | 0.0 /100 | #319 | Tragic 13.8% |
| Apache | 0.0 /100 | #320 | Tragic 13.9% |
| Paiute | 0.0 /100 | #321 | Tragic 13.9% |
| Americans | 0.0 /100 | #322 | Tragic 13.9% |
| Comanche | 0.0 /100 | #323 | Tragic 14.1% |
| Chippewa | 0.0 /100 | #324 | Tragic 14.1% |
| Natives/Alaskans | 0.0 /100 | #325 | Tragic 14.2% |
Demographics Similar to Whites/Caucasians by Disability
In terms of disability, the demographic groups most similar to Whites/Caucasians are Slovak (13.0%, a difference of 0.0%), African (13.0%, a difference of 0.020%), Cheyenne (13.0%, a difference of 0.060%), Yaqui (13.1%, a difference of 0.29%), and English (13.0%, a difference of 0.43%).
| Demographics | Rating | Rank | Disability |
| Immigrants | Portugal | 0.0 /100 | #281 | Tragic 12.9% |
| Scottish | 0.0 /100 | #282 | Tragic 12.9% |
| Irish | 0.0 /100 | #283 | Tragic 12.9% |
| Welsh | 0.0 /100 | #284 | Tragic 12.9% |
| Crow | 0.0 /100 | #285 | Tragic 12.9% |
| English | 0.0 /100 | #286 | Tragic 13.0% |
| Africans | 0.0 /100 | #287 | Tragic 13.0% |
| Whites/Caucasians | 0.0 /100 | #288 | Tragic 13.0% |
| Slovaks | 0.0 /100 | #289 | Tragic 13.0% |
| Cheyenne | 0.0 /100 | #290 | Tragic 13.0% |
| Yaqui | 0.0 /100 | #291 | Tragic 13.1% |
| Aleuts | 0.0 /100 | #292 | Tragic 13.1% |
| Marshallese | 0.0 /100 | #293 | Tragic 13.1% |
| Celtics | 0.0 /100 | #294 | Tragic 13.1% |
| Immigrants | Nonimmigrants | 0.0 /100 | #295 | Tragic 13.2% |