Immigrants from Russia vs Immigrants from Cuba Disability
COMPARE
Immigrants from Russia
Immigrants from Cuba
Disability
Disability Comparison
Immigrants from Russia
Immigrants from Cuba
11.1%
DISABILITY
98.9/ 100
METRIC RATING
86th/ 347
METRIC RANK
11.6%
DISABILITY
62.8/ 100
METRIC RATING
161st/ 347
METRIC RANK
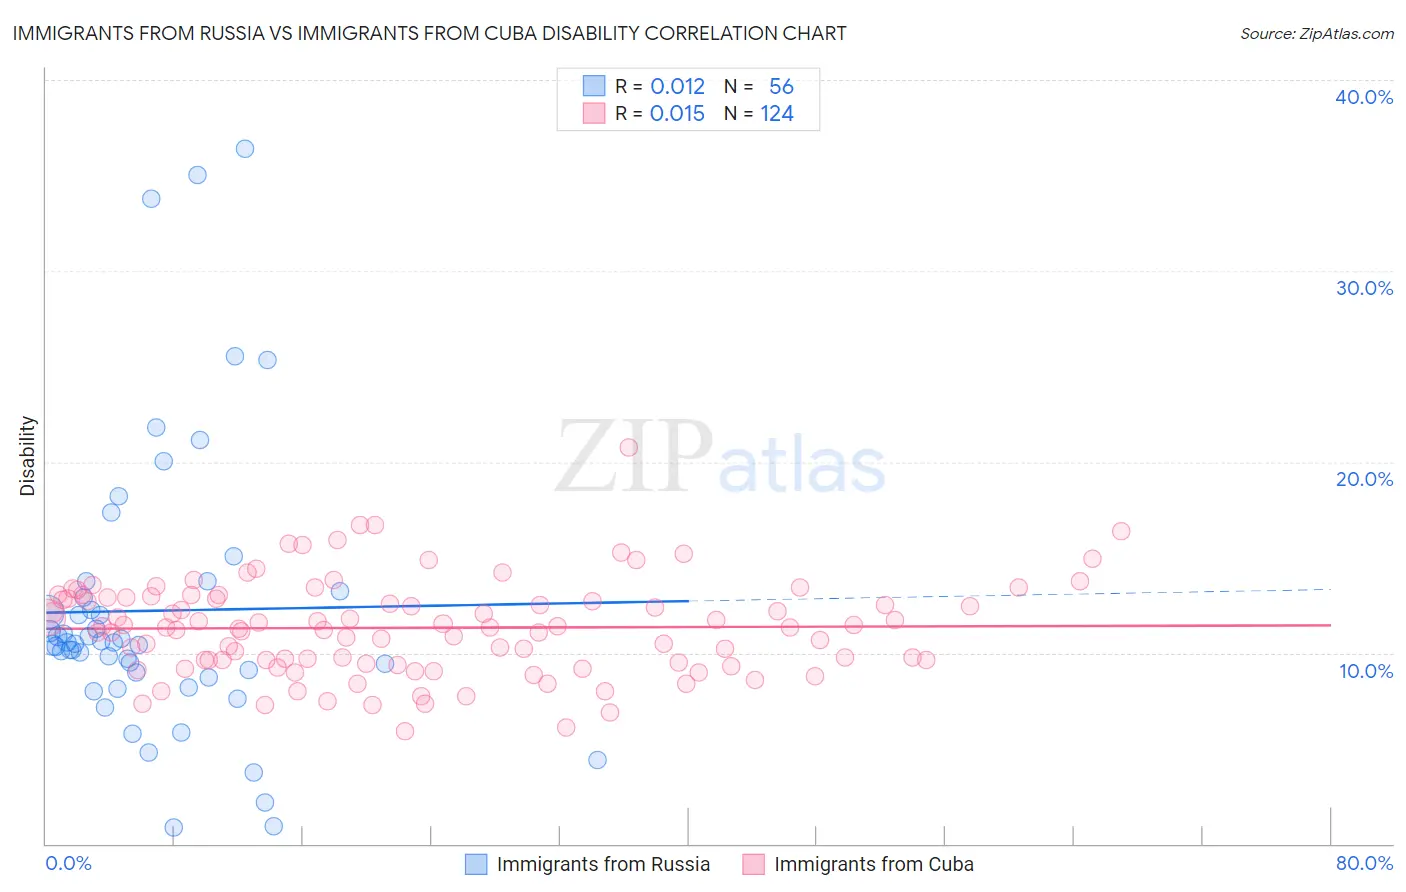
Immigrants from Russia vs Immigrants from Cuba Disability Correlation Chart
The statistical analysis conducted on geographies consisting of 347,926,154 people shows no correlation between the proportion of Immigrants from Russia and percentage of population with a disability in the United States with a correlation coefficient (R) of 0.012 and weighted average of 11.1%. Similarly, the statistical analysis conducted on geographies consisting of 325,999,543 people shows no correlation between the proportion of Immigrants from Cuba and percentage of population with a disability in the United States with a correlation coefficient (R) of 0.015 and weighted average of 11.6%, a difference of 4.6%.
Disability Correlation Summary
| Measurement | Immigrants from Russia | Immigrants from Cuba |
| Minimum | 0.87% | 5.9% |
| Maximum | 36.4% | 20.7% |
| Range | 35.5% | 14.8% |
| Mean | 12.2% | 11.3% |
| Median | 10.5% | 11.3% |
| Interquartile 25% (IQ1) | 8.9% | 9.6% |
| Interquartile 75% (IQ3) | 13.1% | 12.9% |
| Interquartile Range (IQR) | 4.2% | 3.3% |
| Standard Deviation (Sample) | 7.5% | 2.5% |
| Standard Deviation (Population) | 7.4% | 2.5% |
Similar Demographics by Disability
Demographics Similar to Immigrants from Russia by Disability
In terms of disability, the demographic groups most similar to Immigrants from Russia are Immigrants from Belarus (11.1%, a difference of 0.0%), Palestinian (11.1%, a difference of 0.040%), Immigrants from Sierra Leone (11.1%, a difference of 0.15%), Immigrants from Switzerland (11.1%, a difference of 0.17%), and Chilean (11.1%, a difference of 0.20%).
| Demographics | Rating | Rank | Disability |
| Immigrants | Jordan | 99.3 /100 | #79 | Exceptional 11.1% |
| Immigrants | Ireland | 99.3 /100 | #80 | Exceptional 11.1% |
| Immigrants | Poland | 99.1 /100 | #81 | Exceptional 11.1% |
| Chileans | 99.1 /100 | #82 | Exceptional 11.1% |
| Immigrants | Switzerland | 99.0 /100 | #83 | Exceptional 11.1% |
| Immigrants | Sierra Leone | 99.0 /100 | #84 | Exceptional 11.1% |
| Immigrants | Belarus | 98.9 /100 | #85 | Exceptional 11.1% |
| Immigrants | Russia | 98.9 /100 | #86 | Exceptional 11.1% |
| Palestinians | 98.9 /100 | #87 | Exceptional 11.1% |
| Immigrants | Romania | 98.5 /100 | #88 | Exceptional 11.2% |
| Immigrants | South Africa | 98.2 /100 | #89 | Exceptional 11.2% |
| Immigrants | Brazil | 98.1 /100 | #90 | Exceptional 11.2% |
| Immigrants | Western Asia | 98.1 /100 | #91 | Exceptional 11.2% |
| Ecuadorians | 98.0 /100 | #92 | Exceptional 11.2% |
| Immigrants | Ecuador | 98.0 /100 | #93 | Exceptional 11.2% |
Demographics Similar to Immigrants from Cuba by Disability
In terms of disability, the demographic groups most similar to Immigrants from Cuba are Immigrants from Barbados (11.6%, a difference of 0.070%), Guatemalan (11.6%, a difference of 0.11%), Armenian (11.6%, a difference of 0.15%), Immigrants from Haiti (11.7%, a difference of 0.17%), and Immigrants from Trinidad and Tobago (11.7%, a difference of 0.19%).
| Demographics | Rating | Rank | Disability |
| Immigrants | Guatemala | 71.1 /100 | #154 | Good 11.6% |
| Immigrants | Netherlands | 69.8 /100 | #155 | Good 11.6% |
| Immigrants | Fiji | 69.5 /100 | #156 | Good 11.6% |
| Immigrants | Middle Africa | 69.5 /100 | #157 | Good 11.6% |
| Armenians | 65.9 /100 | #158 | Good 11.6% |
| Guatemalans | 65.1 /100 | #159 | Good 11.6% |
| Immigrants | Barbados | 64.2 /100 | #160 | Good 11.6% |
| Immigrants | Cuba | 62.8 /100 | #161 | Good 11.6% |
| Immigrants | Haiti | 59.2 /100 | #162 | Average 11.7% |
| Immigrants | Trinidad and Tobago | 58.9 /100 | #163 | Average 11.7% |
| Syrians | 58.5 /100 | #164 | Average 11.7% |
| Cubans | 56.7 /100 | #165 | Average 11.7% |
| Pakistanis | 54.7 /100 | #166 | Average 11.7% |
| Estonians | 54.4 /100 | #167 | Average 11.7% |
| Immigrants | Latin America | 54.1 /100 | #168 | Average 11.7% |