Yaqui vs White/Caucasian Disability
COMPARE
Yaqui
White/Caucasian
Disability
Disability Comparison
Yaqui
Whites/Caucasians
13.1%
DISABILITY
0.0/ 100
METRIC RATING
291st/ 347
METRIC RANK
13.0%
DISABILITY
0.0/ 100
METRIC RATING
288th/ 347
METRIC RANK
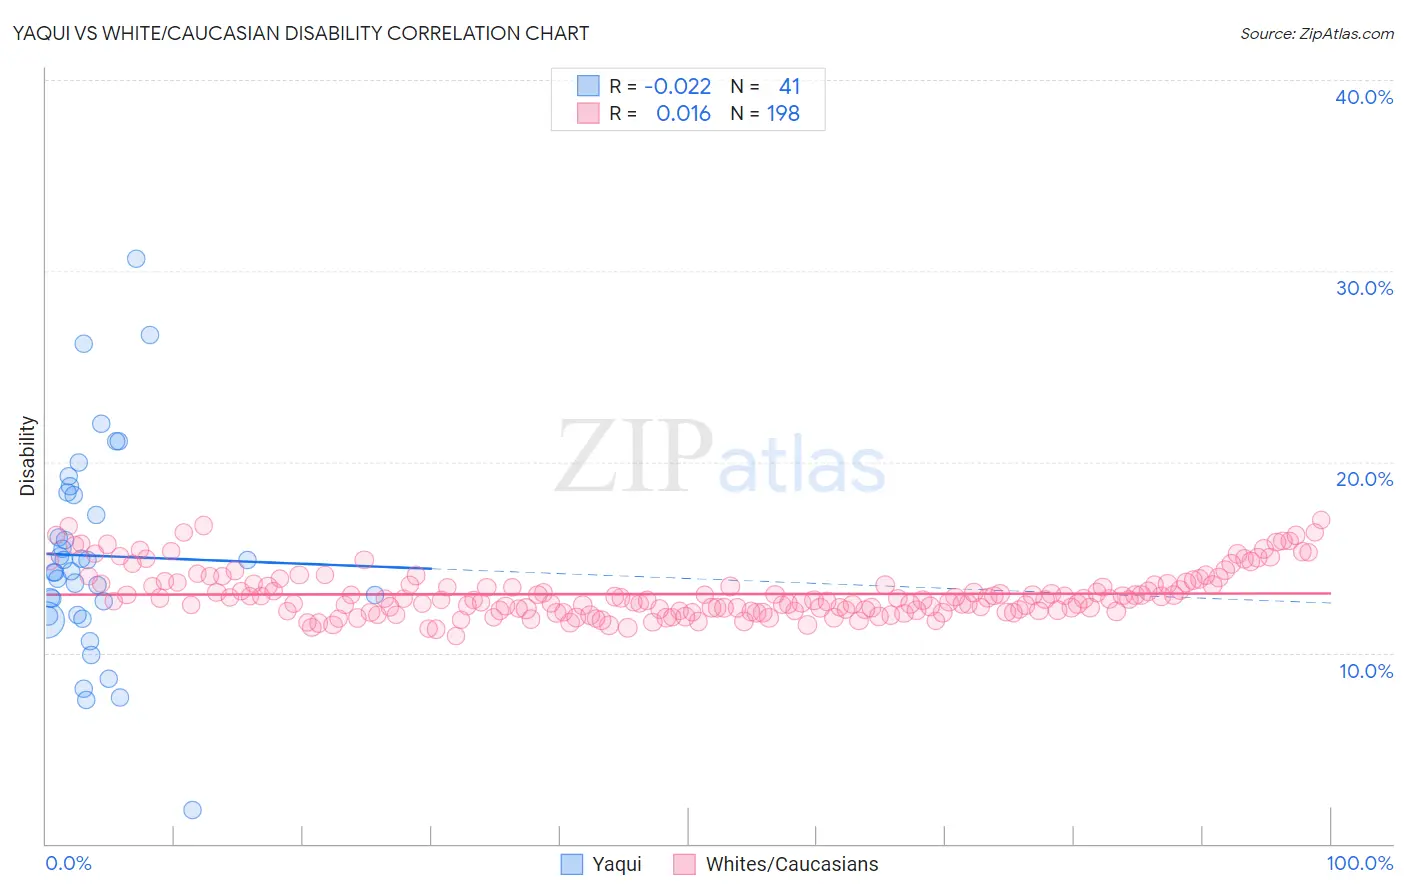
Yaqui vs White/Caucasian Disability Correlation Chart
The statistical analysis conducted on geographies consisting of 107,721,250 people shows no correlation between the proportion of Yaqui and percentage of population with a disability in the United States with a correlation coefficient (R) of -0.022 and weighted average of 13.1%. Similarly, the statistical analysis conducted on geographies consisting of 583,070,894 people shows no correlation between the proportion of Whites/Caucasians and percentage of population with a disability in the United States with a correlation coefficient (R) of 0.016 and weighted average of 13.0%, a difference of 0.29%.
Disability Correlation Summary
| Measurement | Yaqui | White/Caucasian |
| Minimum | 1.8% | 10.9% |
| Maximum | 30.6% | 16.9% |
| Range | 28.9% | 6.1% |
| Mean | 15.1% | 13.1% |
| Median | 14.3% | 12.8% |
| Interquartile 25% (IQ1) | 12.0% | 12.2% |
| Interquartile 75% (IQ3) | 18.3% | 13.6% |
| Interquartile Range (IQR) | 6.3% | 1.4% |
| Standard Deviation (Sample) | 5.5% | 1.3% |
| Standard Deviation (Population) | 5.4% | 1.3% |
Demographics Similar to Yaqui and Whites/Caucasians by Disability
In terms of disability, the demographic groups most similar to Yaqui are Cheyenne (13.0%, a difference of 0.23%), Slovak (13.0%, a difference of 0.28%), African (13.0%, a difference of 0.31%), Aleut (13.1%, a difference of 0.36%), and Marshallese (13.1%, a difference of 0.36%). Similarly, the demographic groups most similar to Whites/Caucasians are Slovak (13.0%, a difference of 0.0%), African (13.0%, a difference of 0.020%), Cheyenne (13.0%, a difference of 0.060%), English (13.0%, a difference of 0.43%), and Aleut (13.1%, a difference of 0.65%).
| Demographics | Rating | Rank | Disability |
| Fijians | 0.0 /100 | #279 | Tragic 12.8% |
| Spanish | 0.0 /100 | #280 | Tragic 12.8% |
| Immigrants | Portugal | 0.0 /100 | #281 | Tragic 12.9% |
| Scottish | 0.0 /100 | #282 | Tragic 12.9% |
| Irish | 0.0 /100 | #283 | Tragic 12.9% |
| Welsh | 0.0 /100 | #284 | Tragic 12.9% |
| Crow | 0.0 /100 | #285 | Tragic 12.9% |
| English | 0.0 /100 | #286 | Tragic 13.0% |
| Africans | 0.0 /100 | #287 | Tragic 13.0% |
| Whites/Caucasians | 0.0 /100 | #288 | Tragic 13.0% |
| Slovaks | 0.0 /100 | #289 | Tragic 13.0% |
| Cheyenne | 0.0 /100 | #290 | Tragic 13.0% |
| Yaqui | 0.0 /100 | #291 | Tragic 13.1% |
| Aleuts | 0.0 /100 | #292 | Tragic 13.1% |
| Marshallese | 0.0 /100 | #293 | Tragic 13.1% |
| Celtics | 0.0 /100 | #294 | Tragic 13.1% |
| Immigrants | Nonimmigrants | 0.0 /100 | #295 | Tragic 13.2% |
| Central American Indians | 0.0 /100 | #296 | Tragic 13.2% |
| Hopi | 0.0 /100 | #297 | Tragic 13.2% |
| Alaska Natives | 0.0 /100 | #298 | Tragic 13.2% |
| French | 0.0 /100 | #299 | Tragic 13.2% |